E-Commerce Business Overview
Combine your Shopify, GA4, Google Ads, and Facebook data for insights across your business.
Imagine being able to generate insights from your data within minutes, whilst a data scientist takes over an hour using R or Python. That’s the benefit of using these exploratory data analysis tools.

In a nutshell, exploratory data analysis (EDA) is the process “exploring” the data to try and make sense of it.
The process usually involves:
It’s almost universally agreed that exploratory data analysis is a crucial step in data analysis.
Data scientists often use R or Python to perform EDA. Problem is, this isn’t possible for everyday people or small businesses, as they require programming knowledge.
Instead, let me recommend some tools which allow you to do essentially the same thing with no coding experience required. Data analysts/scientists can also benefit from these tools as well, as they are a huge time saver.

Polymer Search is a tool that allows users to harness the power of AI to generate insights from their data and create interactive databases that allows for easy filtering and data exploration.
When I worked at Google for 6 years, I did nothing but analyze marketing data all day using R & Python. I found these tools to be inconvenient, time consuming and even confusing at times.
Polymer Search was created as a way for people to do exactly what I did, but 10x faster and simpler.
Everything on Polymer is interactive, making it super easy to explore and understand your data. Best of all - everything can be deployed into a shareable web application within seconds for easy reporting.
The main features include: an interactive spreadsheet, interactive pivot table, interactive graphs/charts, the ‘auto-explainer’ feature that allows you to instantly generate summaries, rankings and find anomalies within the data, and ‘Smart Start’ where you can use the AI to suggest insights about your data.
This tool is especially powerful for marketers, salespeople and business intelligence people looking to perform analysis and present their data.

R is complicated to learn with not so great documentation available, however, Rattle is the opposite. It is a graphical interface for R which allows in-depth data mining and requires no coding, no command line prompts - just clicks.
Rattle allows you to easily explore your data and create quick visualizations. You can also use it to clean & transform your data and build models.
The tool is fast and ideal for handling big data for those who don’t know how to code.
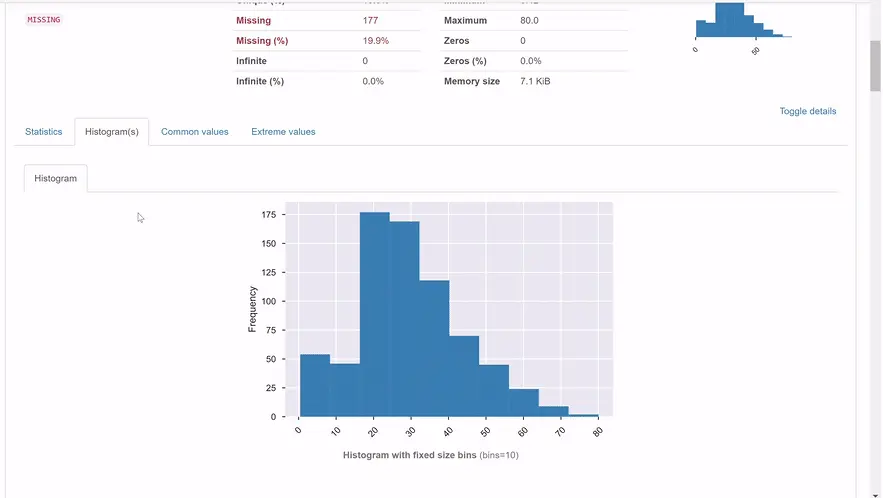
Pandas Profiling is an open source Python module which allows both non-technical users and data scientists to quickly perform EDA and present the information on a web-based interactive report.
Using Pandas Profiling, you generate interactive graphs/charts and visualize the distribution of each variable in the dataset using just a few lines of code.
Data scientists often use Pandas Profiling to save hours of time needed for the EDA process.

DataPrep is a tool on Python that saves countless hours of cleansing, preparing data and performing EDA. It works similarly to Pandas Profiling - that within a couple lines of code, you can plot a series of interactive graphs and distributions charts to get an overall sense of the data.
You can also find & analyze missing values and outliers within seconds using a few lines of code. This allows the user to be aware of data quality in each column and find possible reasons for these missing values or outliers.
Overall, DataPrep is a very powerful tool for cleansing data, analyzing missing variables, checking correlations and seeing the distribution of each variable.
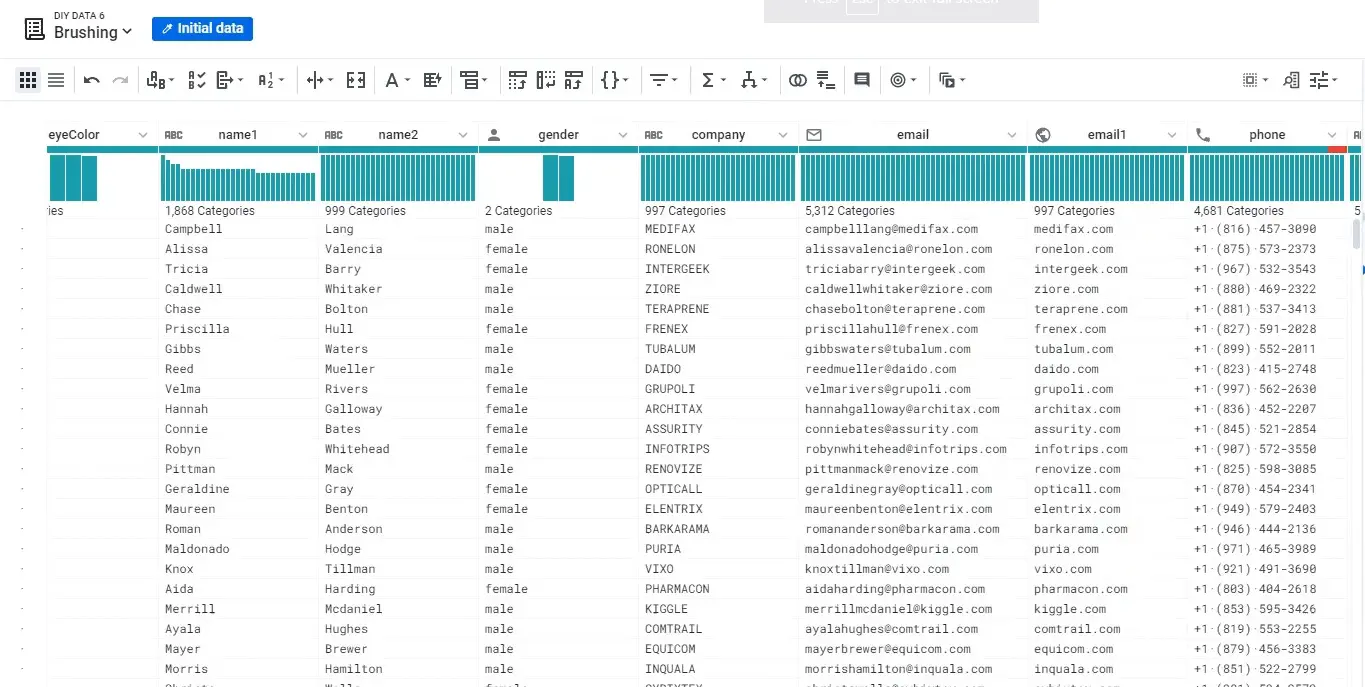
Trifacta allows you to prepare and explore any dataset on cloud data warehouse or cloud data lakehouse through an interactive user interface.
The tool uses in-built machine learning algorithms to guide you through the exploration of your data.
One of its features is data profiling: determining how accurate, complete and valid a dataset is. Trifacta does this automatically with its intelligent AI.
Another feature is its no-code ETL (extract, transform, load) or ELT. You can transform your dataset simply by providing an example format, and the machine learning algorithm will fill in the rest.

KNIME is a tool that allows you to dive deep into data processing without learning how to code.
KNIME is often used by data scientists, especially from the chem/biotech industry, for data processing and building production grade applications. It has plenty of features that’ll come in hand for exploratory data analysis including data cleansing and manipulation, merging datasets together, creating interactive visualizations and building models.
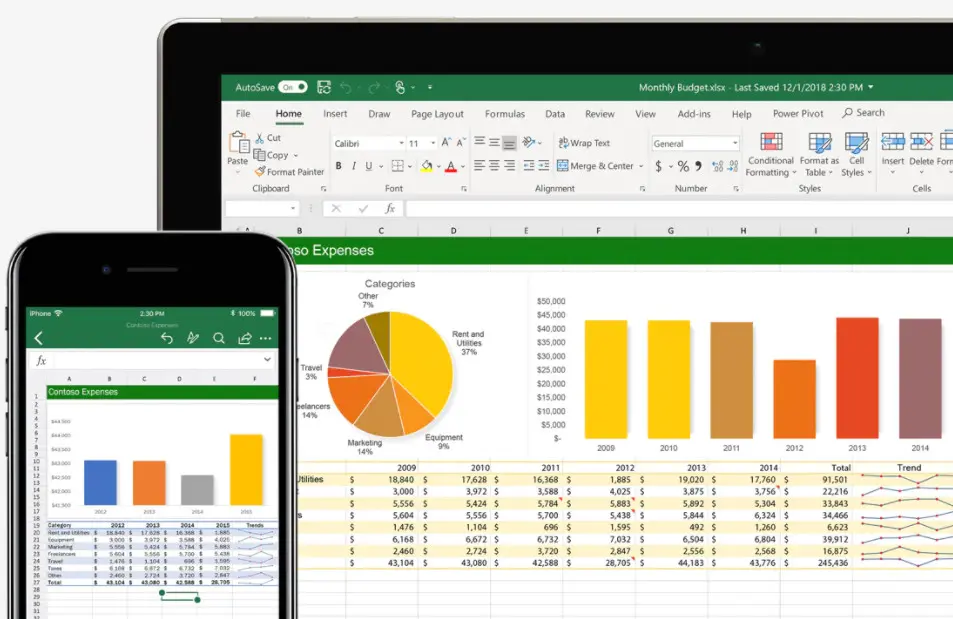
For many datasets, Excel is all that’s needed for data analysis. The advantages of Excel are that it’s easy to cleanse/manipulate the dataset using basic Excel functions, and it’s ultra convenient to quickly create graphs/charts.
Although Excel is a paid program, Google Sheets is a free alternative that does exactly the same thing.
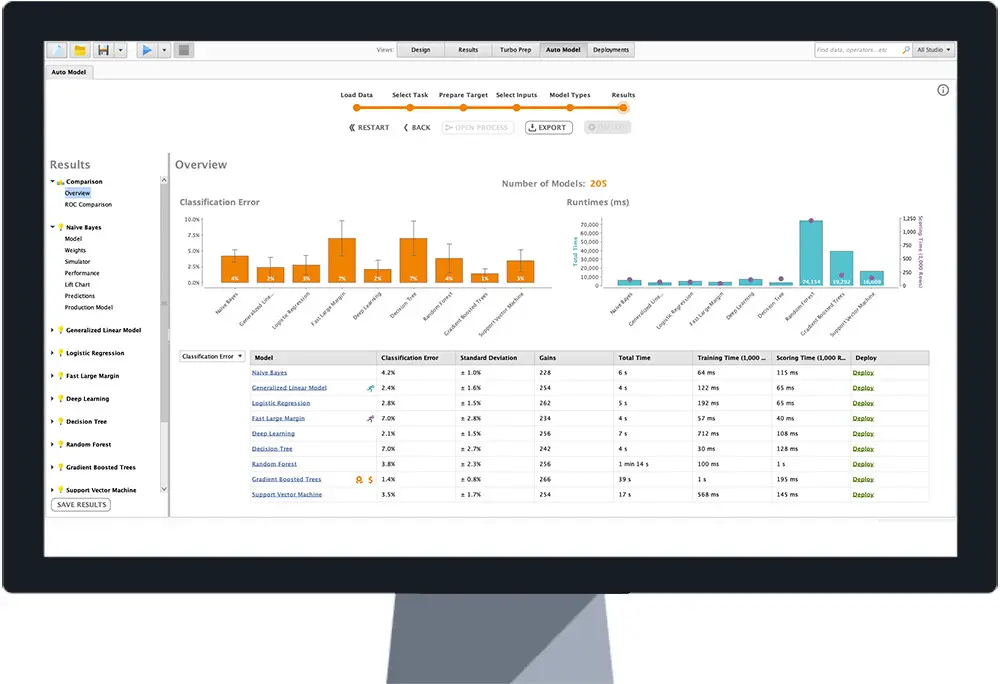
Rapidminer is a no-code solution for non-technical people to do advanced data mining. For stuff like using text mining to build predictive models, it can take several months of learning to do that in R or Python, but using Rapidminer, you can learn to do that in days or weeks.
Rapidminer also allows more advanced users to pull in their R or Python scripts seamlessly. Although Rapidminer handles big data relatively well and can be used for machine learning, do note that it's slower and inferior to R and Python.
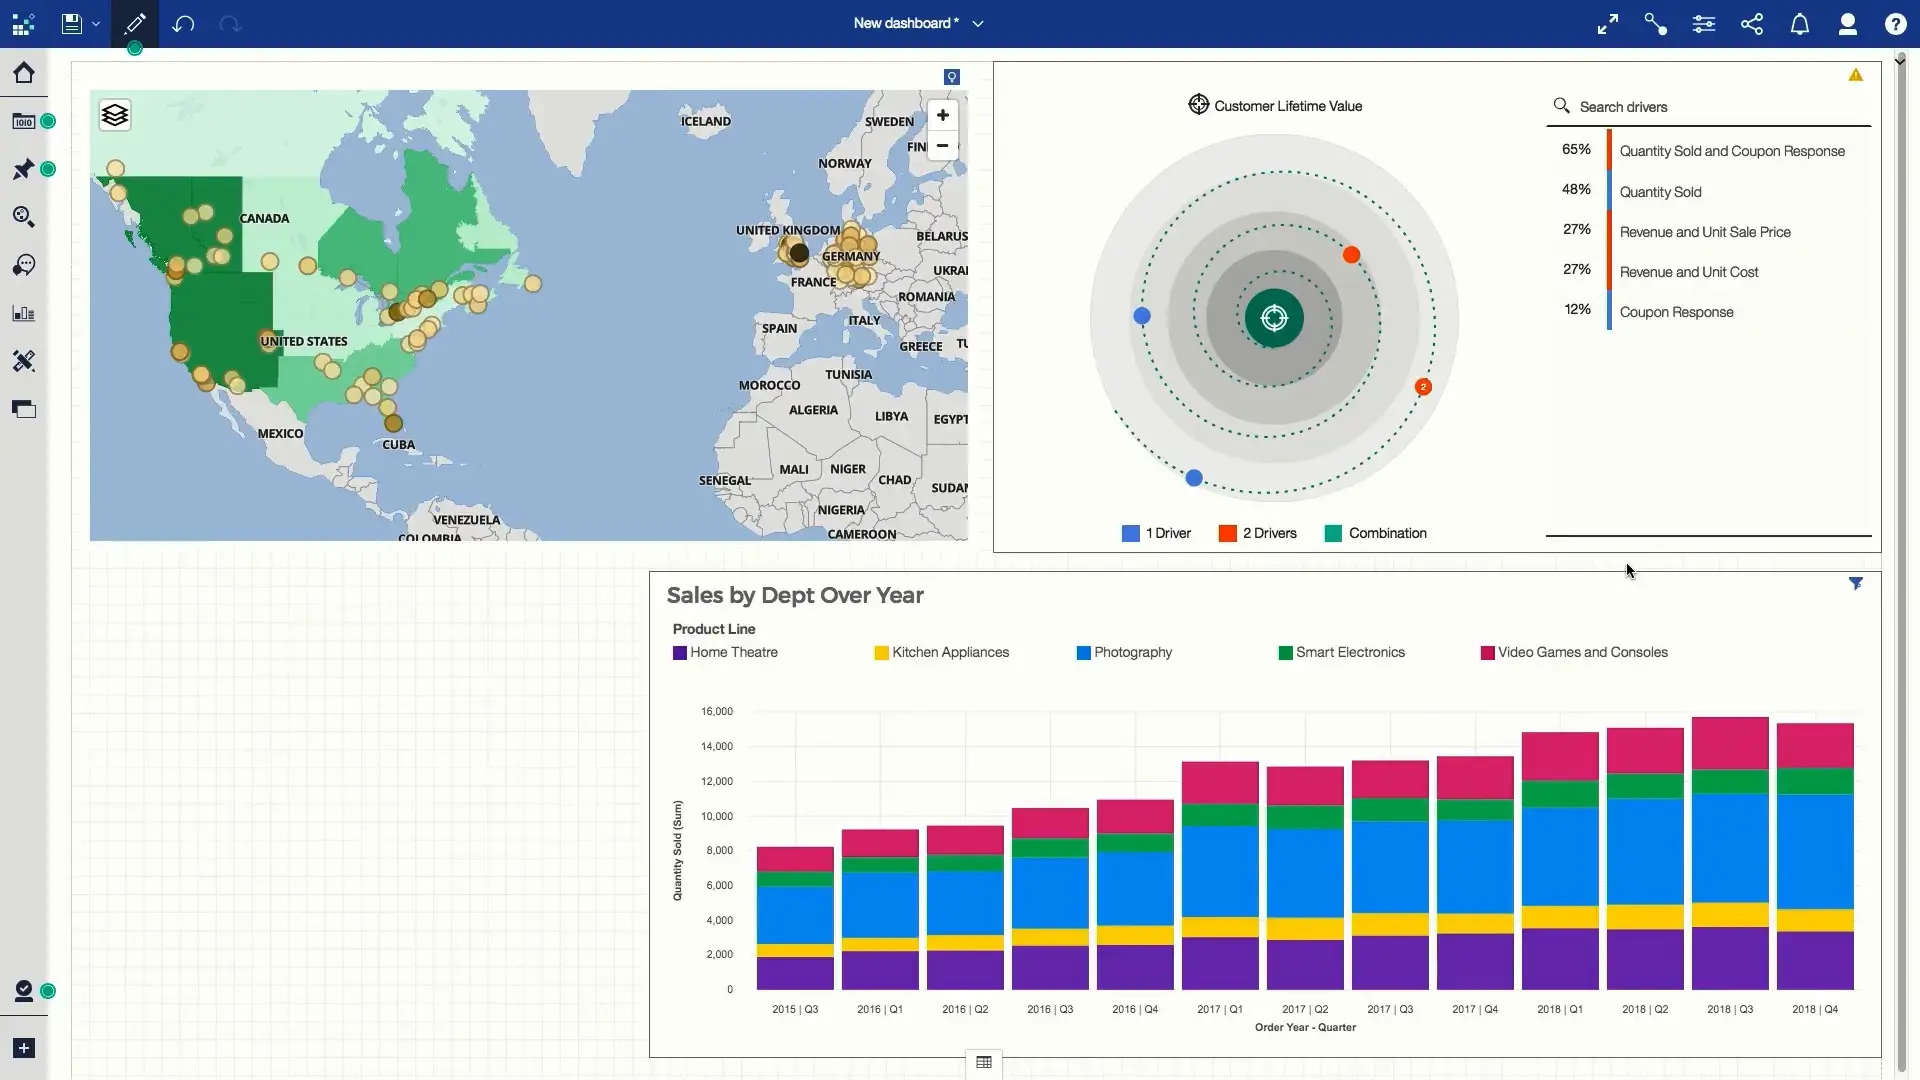
IBM Cognos Analytics is a business intelligence tool designed for business professionals who aren’t data-savvy. Using its built-in AI tools, users can explore and generate insights about their data in a matter of clicks. The tool also automates data preparation for cleansing and aggregating data.
Exploratory data analysis doesn't have to be complicated. You really don't need any prior coding experience to get started on this. Given the rise of numerous tools and platforms, it's more accessible than ever for both professionals and enthusiasts to perform EDA without delving deep into coding. Whether you're a business professional looking for quick insights or a data enthusiast aiming to understand complex patterns, tools like Tableau and Orange, alongside the ones mentioned earlier, offer robust solutions for your needs.
Even if you have coding experience, these exploratory data analysis software options can significantly expedite the analysis process, giving you more time to focus on deriving actionable insights.
See for yourself how fast and easy it is to uncover profitable insights hidden in your data. Get started today, free for 7 days.
Try Polymer For Free


