.svg)
Setting up a connection from BigQuery to Polymer
Easily set up a connection from BigQuery to Google Sheets with the data you need for analysis. This data can be updated on a regular cadence & synced with your Polymer boards.

If your data is already living in BigQuery, you can easily set up a connection from BigQuery to Google Sheets with the data you need for analysis. This data can be updated on a regular cadence & synced with your Polymer boards.
This connection flow would be helpful especially if you use some connectors or internal data sources that Polymer doesn’t currently have live access to!
Getting BigQuery Data into a Google Sheet
To begin, you’ll first need to get your BigQuery data into Google Sheets.
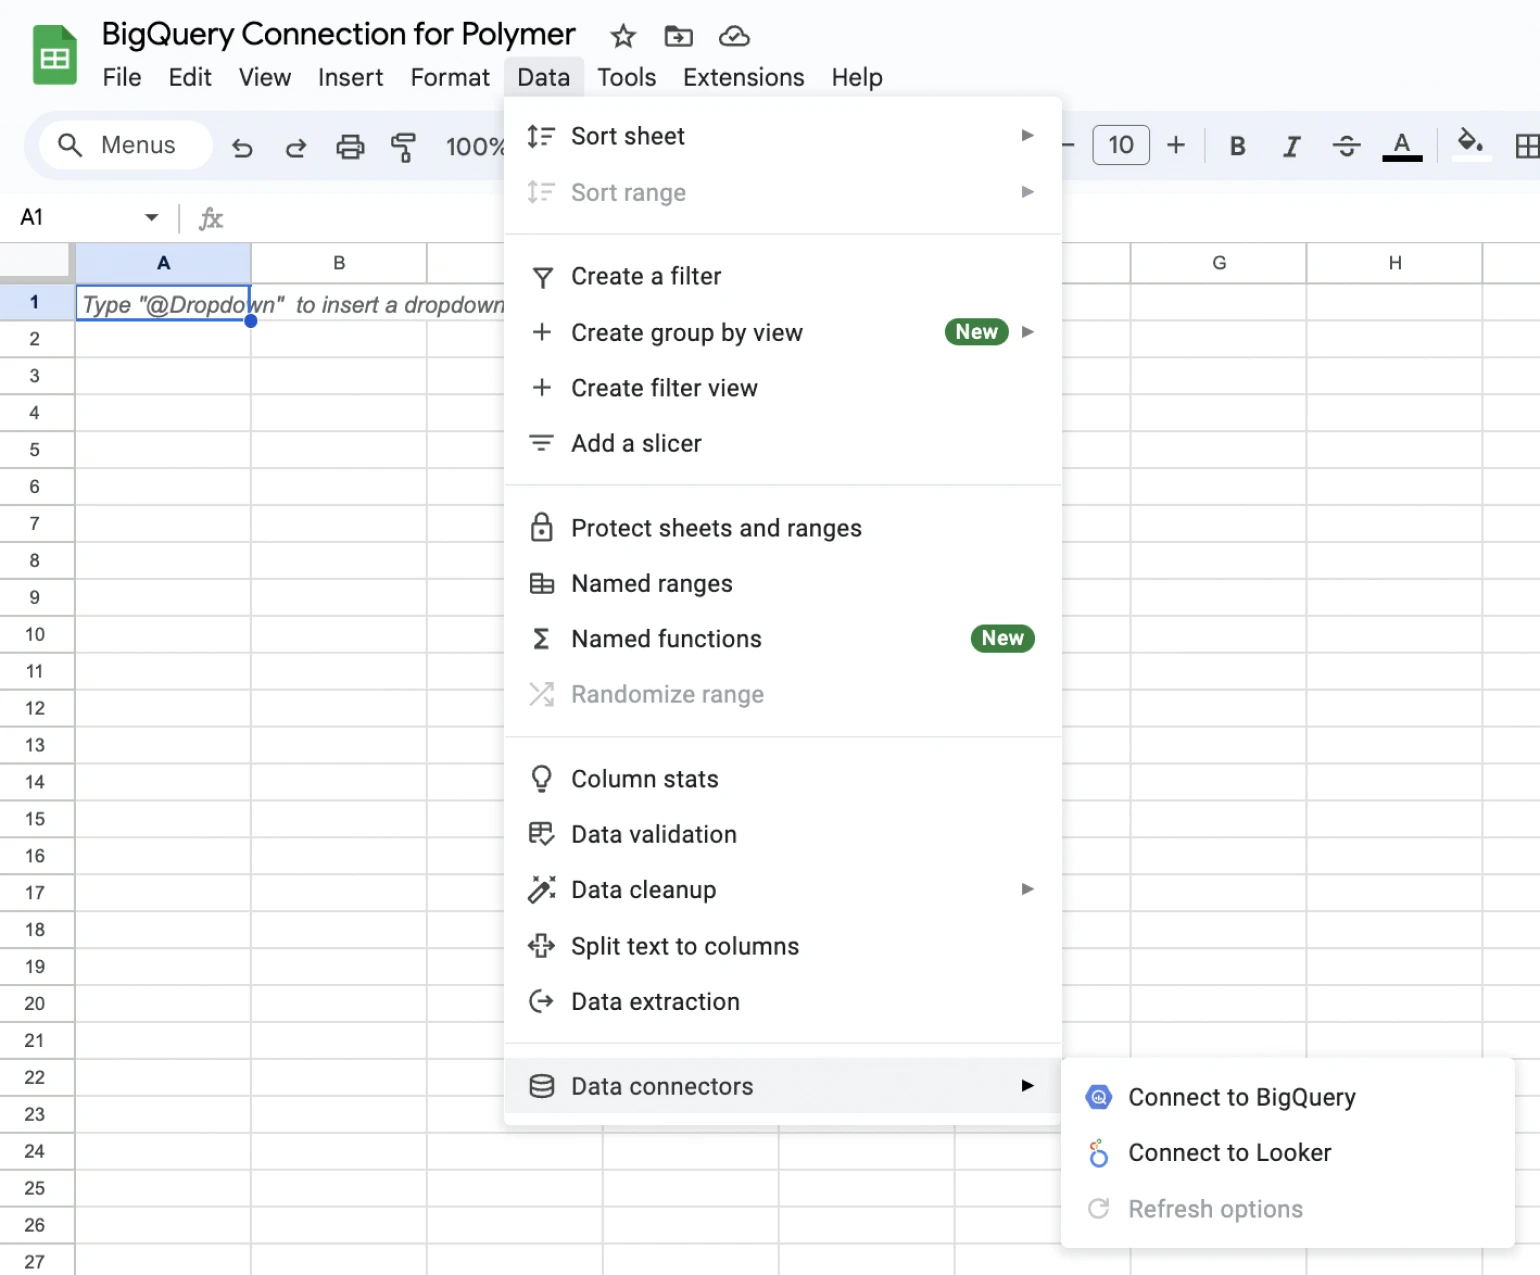
Open a new sheet in Google Sheets where you’d like to connect the data.Go to the Data tab and select Data Connectors > Connect to BigQuery.
- Open a new sheet in Google Sheets where you’d like to connect the data.
- Go to the Data tab and select Data Connectors > Connect to BigQuery.
- Follow the connection steps that appear on the screen, which include:
- Choose a cloud project.
- Choose a dataset and table/view. You can pick from any table you have access to or start with a public dataset for a proof of concept.
- Click Connect to finalize the selection.
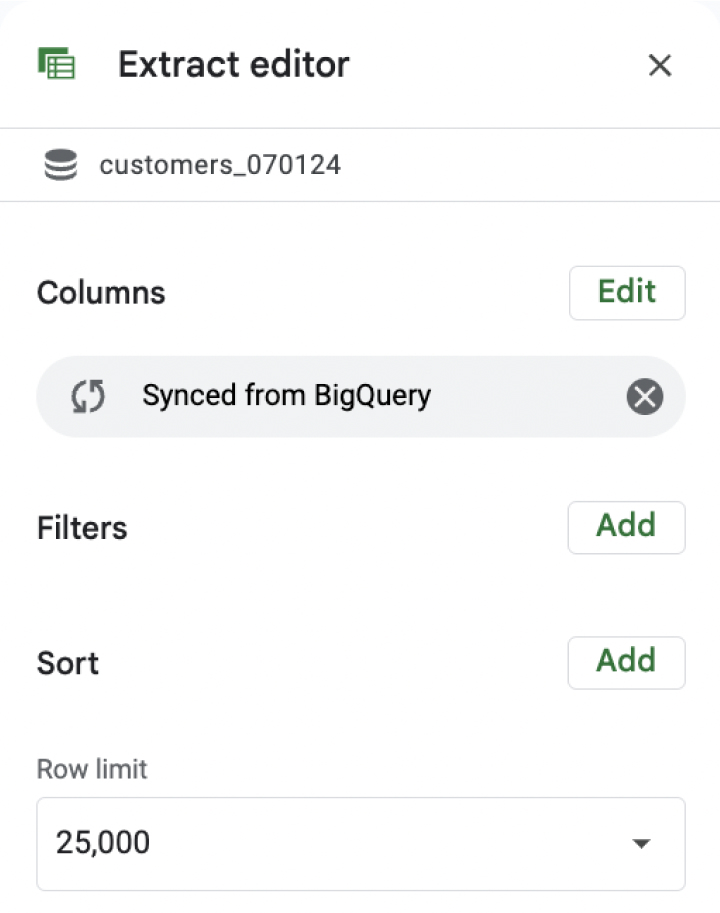
- Create an extract with a subset of the larger database. You can select the specific columns you want to work with, then apply filters, sort by some value, or just grab the first X number of rows. This step is important because this is the tab of data you'll connect with Polymer!
Actions You Can Take with Your Connected Data
From here, you can take several actions:
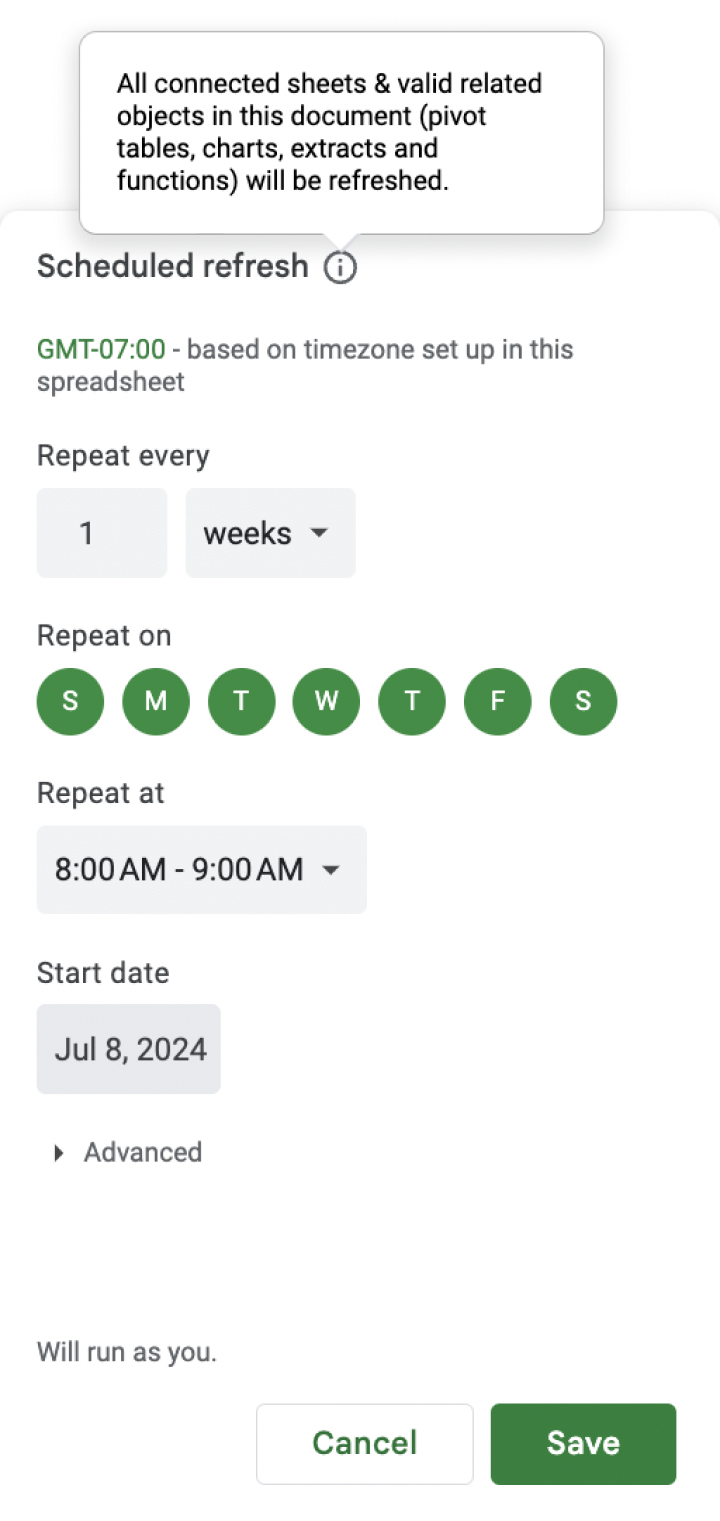
- Refresh on a schedule: The BigQuery connection can be refreshed on a schedule so you’re always getting the newest data from your database! This will also update any extracts coming from that connection. Paired with auto-syncing in Polymer, you’ll have yourself a fully automated data workflow from database to data extraction to presentation!
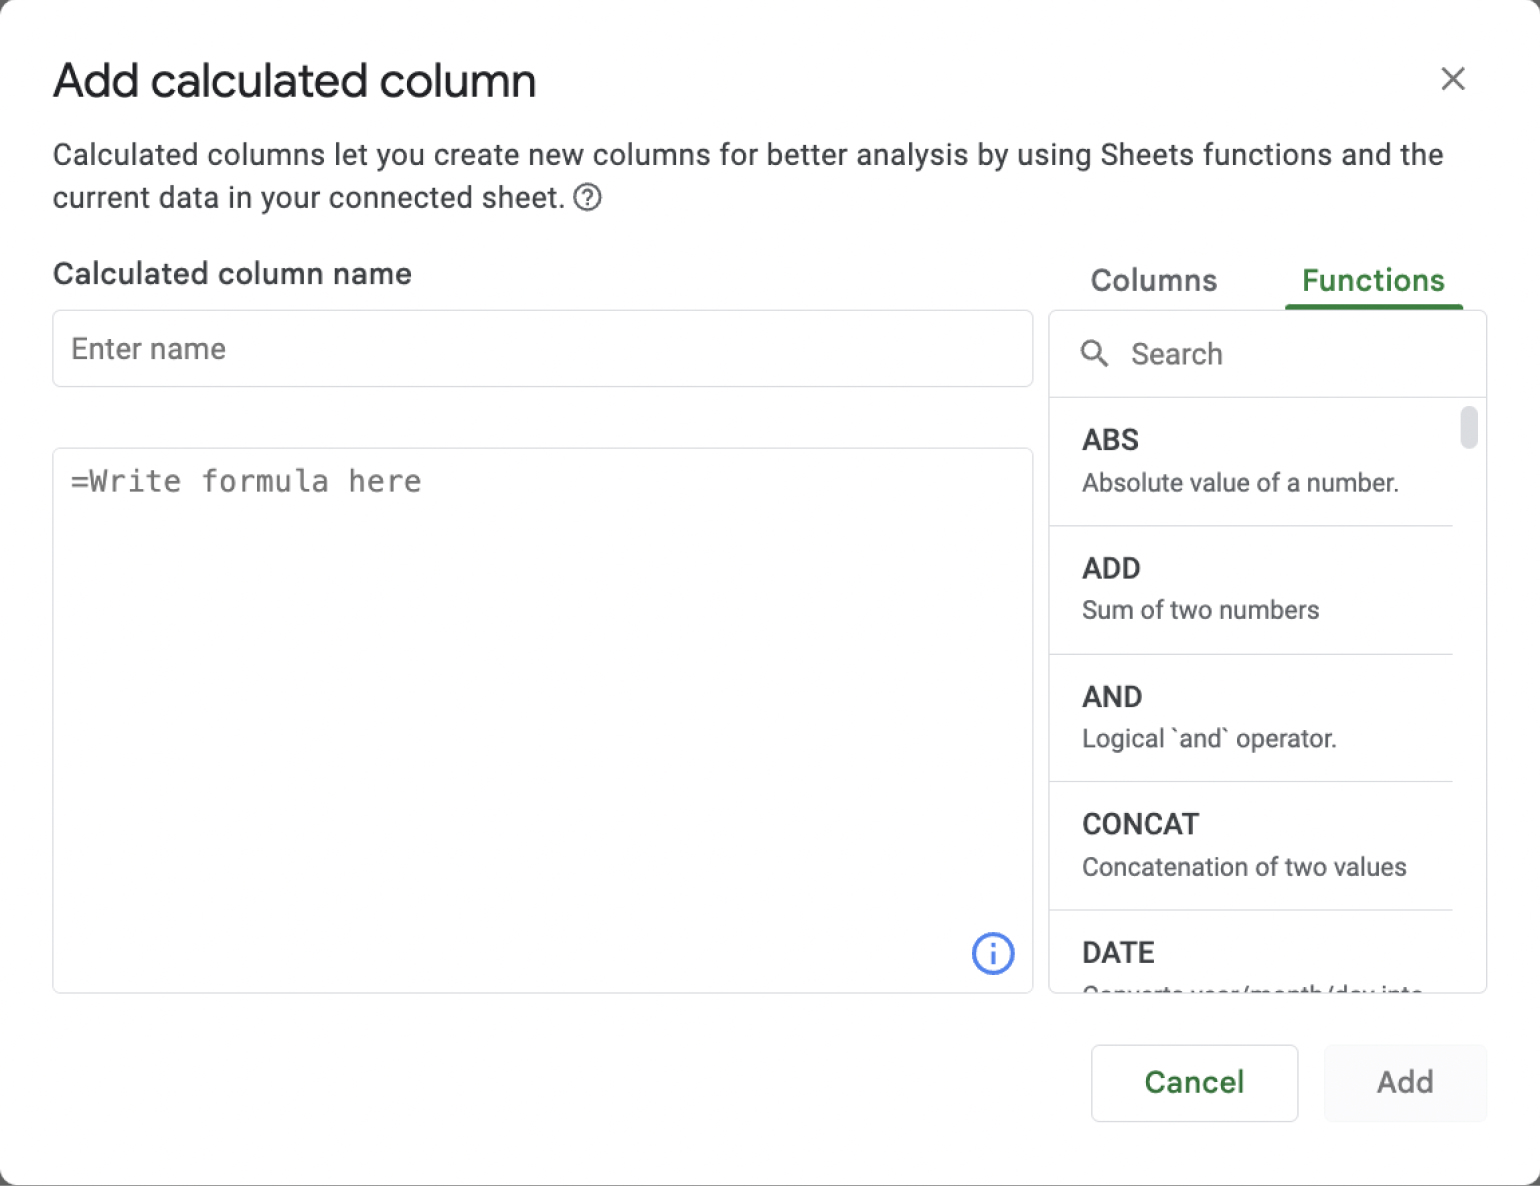
- Create a calculated column to extract date information like month or year, or an IF statement to create new groupings in the data. Doing this within your BigQuery editor rather than in a standard Google Sheet spreadsheet has the advantage of not needing to copy the formula down for new data. It’s a function applied to whatever data is currently in the sheet, up to that last update!
Connecting Google Sheets to Polymer
Once your BigQuery data is synced with a Google Sheet, the next step is connecting that Google Sheet to Polymer. This process involves just a few easy steps:
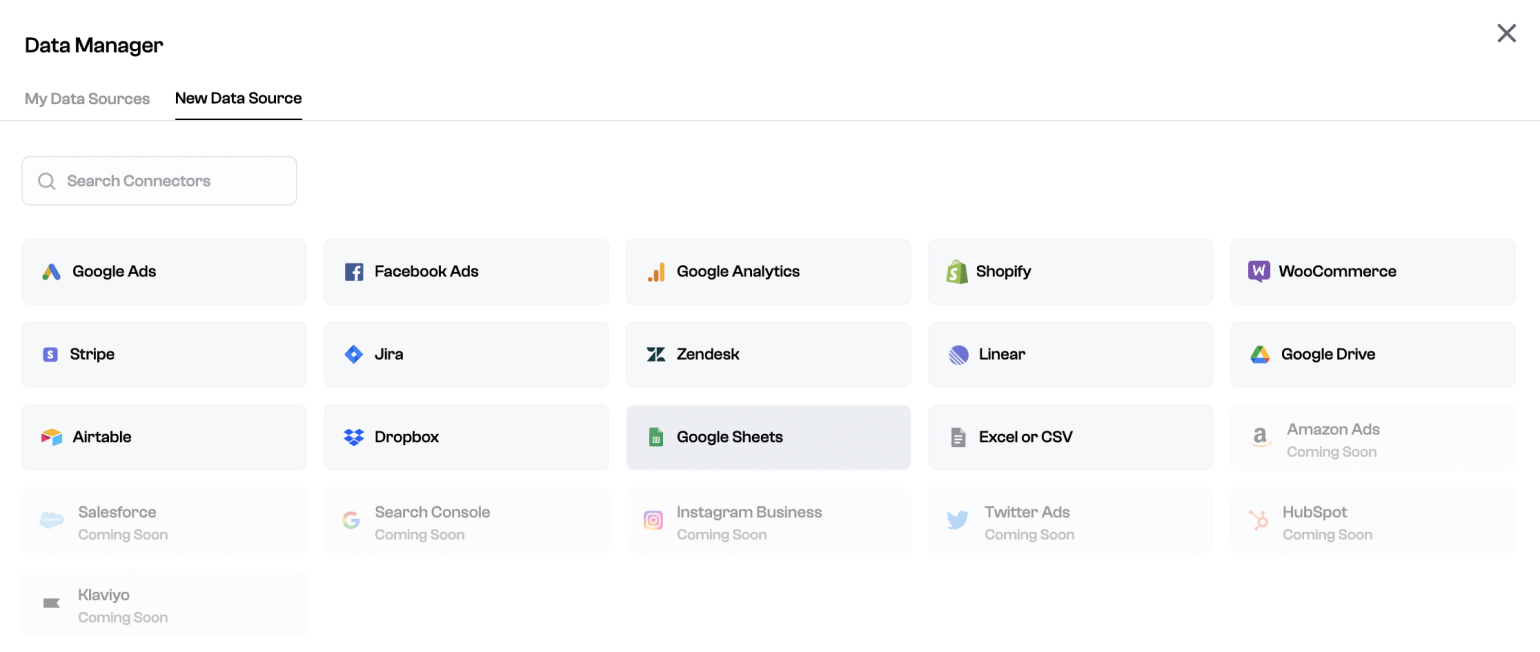
- Select Google Sheets from Polymer’s list of connection options. You can connect a new source from the data manager.
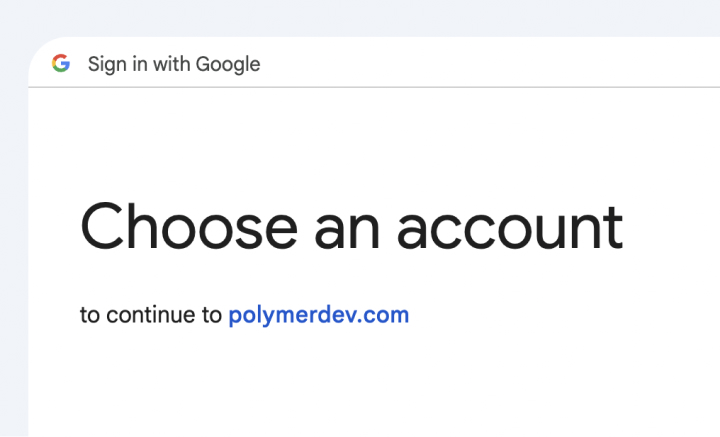
- Authenticate with your Google account.
- If your sheet contains many tabs of data, you can select the specific one(s) you’d like to connect.

As an optional final step, Polymer automatically sets up daily syncing for you, but you can adjust this cadence if needed.
Building Live Data Presentations in Polymer from BigQuery Data
That’s it! You now have an automated data pipeline from BigQuery to Polymer. From here, you can take advantage of all that Polymer has to offer, like automatically generated insights, insightful discussions with PolyAI, and live data presentations.
Get started by creating a new board and having Polymer auto-generate it for you. You can customize that board with logos, color palettes, headers, images, or Loom videos, and add some custom visuals from scratch or with the help of PolyAI.
Finally, share a live link to your board in dashboard mode or go into present mode to get a slideshow presentation with AI-generated chart explanations and insights. You can edit these back in dashboard mode to take more control over the narrative.
Start using Polymer right now. Free for 7 days.
See for yourself how fast and easy it is to uncover profitable insights hidden in your data. Get started today, free for 7 days.
Try Polymer For Free


.svg)


