
Template
E-Commerce Business Overview
Combine your Shopify, GA4, Google Ads, and Facebook data for insights across your business.
.svg)
Learn the various Shopify reports and how to make data-driven decisions for your ecommerce business. Understand your customers, sales channels, traffic sources, and more.

No Shopify ecommerce business starts with a perfect blueprint for success.
The priority is testing strategies, tracking performance, and scaling your strategy based on what works.
Shopify ecommerce analytics and reporting are stepping stones toward this goal.
By tracking data, every positive or negative outcome can be turned into progress.
This guide covers everything you need to know about Shopify reporting and how to use data to your advantage.
An ecommerce report is a compilation of analytics data that help evaluate various areas of your business.
It uses visualizations like charts, tables, and scorecards to streamline data analysis, making extracting insights from metrics and Key Performance Indicators (KPIs) easier.
Here are a few examples of ecommerce analytics data you can track:
Ecommerce platforms like Shopify come with built-in reporting capabilities.
Reports from multiple data sources can also be consolidated into a single data management or Business Intelligence (BI) solution. This will simplify your data analytics activities and unlock additional data visualization and reporting features.
Shopify reports enable ecommerce businesses to make data-driven decisions quickly — without spending time and resources on data collection.
To speed up data analysis, Shopify automatically gathers your online store's performance data, such as sales by product vendor, canceled orders, and sales by channel. The platform also utilizes interactive data visualizations and filters to help you find the exact insights you need.
You can view everything through pre-defined reports from your Shopify admin dashboard.
In addition, Shopify ecommerce reports also come with the following benefits:
Of course, Shopify reports come with all the perks of unlocking truckloads of ecommerce analytics data.
By building an ecommerce dashboard, you can understand your best customers, streamline inventory management, optimize your marketing channels, improve your customer service, and more.
It's just a matter of finding the right Shopify report that contains the data you need.
Below are 14 types of Shopify reports you absolutely need to make informed decisions for your ecommerce business:
Shopify has a comprehensive set of reports to provide an in-depth view of your online store's sales performance. Tracking is done in real-time with a refresh delay of about one minute — more than enough to ensure data accuracy and freshness in reports.
Here are examples of metrics covered in sales reports:
Shopify generates different reports for the individual performance of products, sales channels, and discount codes (you'll learn more about these reports below).
Since these reports don't have the exact same data sets, they require different data analysis and reporting techniques. Take a look at some of our Shopify report templates to learn the various methods used to visualize ecommerce sales data.
The sales by channel report focuses on the sales performance of the specific app or online channel used by customers to complete a purchase. This can be your main virtual store, a separate "buy button," your Instagram page, and other connected online marketplaces.
Sales channels can be added directly via your Shopify admin page. Once added, recorded sales will be automatically attributed to the channel where the transaction occurred.
To view the sales by channel report, click 'Analytics' from the main menu and look for the "Sales by channel" section. From there, click 'View report' in the top-right corner.
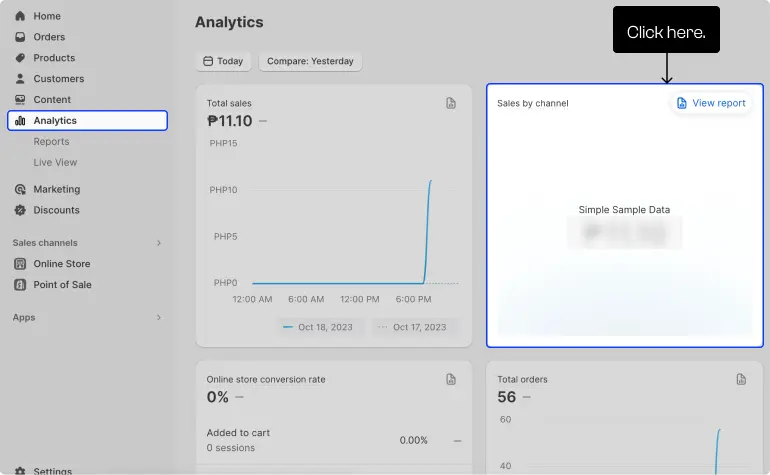
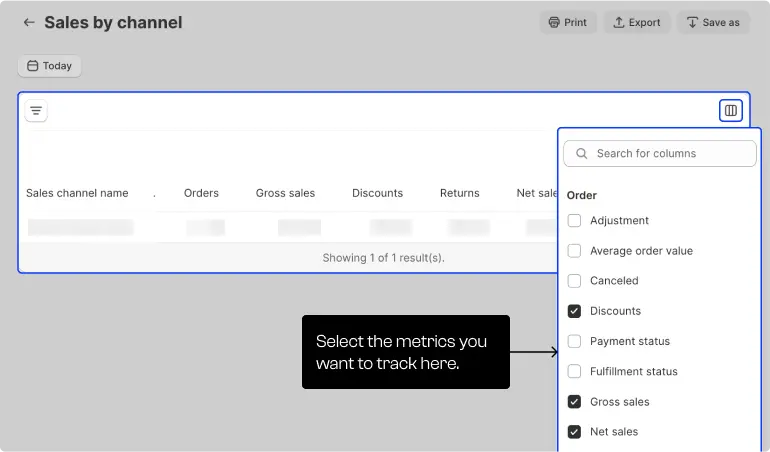
The report lets you track metrics like total orders, gross sales, returns, average order value, and customer type for each connected sales channel or app. Select the metrics you want to track by clicking the 'Columns' button.
Your sales by channel report makes it easy to identify underperforming channels that require your attention. Optimize their performance, simplify the checkout process, and tune your marketing strategies to attract more prospective customers.
Feel free to analyze your top-performing sales channels to identify and replicate strategies that work. Just don't rule out the possibility that your ideal customers simply don't prefer shopping through certain channels, which may explain their poor performance.
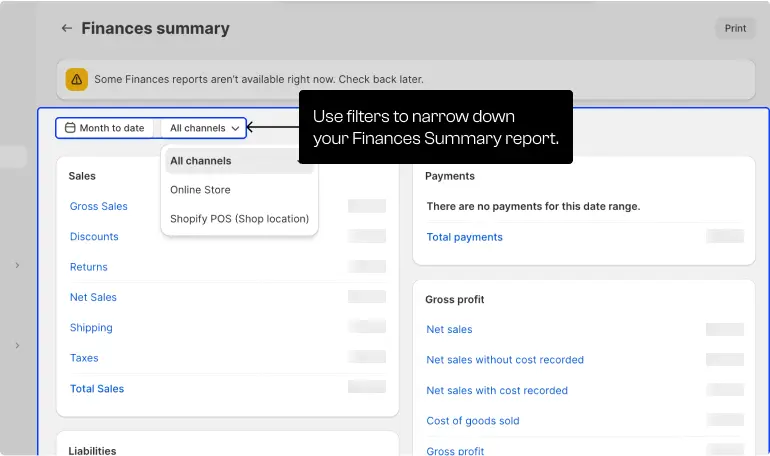
The finance summary report provides a complete overview of your Shopify store's financial health. It tracks aggregate metrics for your entire ecommerce store, including gross sales, taxes, returns, cost of goods sold, and gross profit.
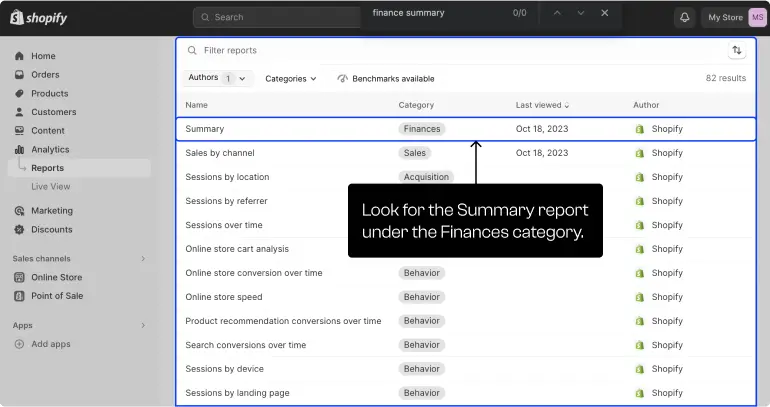
To view your finance summary report, go to 'Analytics' and click 'Reports.' Look for 'Summary' under the "Finances" category to continue.
You'll find several other reports, including sales by product, sales by discount, and first-time vs returning customer sales, on the reports page.
Your finance summary report is split into four sections: sales, payments, liabilities, and gross profit. If you need to narrow down your report, set a date range or sales channel using the filters using the top toolbar.
Using the finance summary report is a great way to evaluate growth and the overall performance of your ecommerce business. It's also useful in identifying problem areas that affect your bottom line, like returns, refunds, and high shipping rates.
The sales by product report lets you dive into the sales performance of individual products. It also tracks important sales metrics like gross sales, returns, and discounts — but organizes the data on a product level.

The best use case for the sales by product report is to highlight your most and least profitable products.
Remember that it's not just about the quantity sold, but also the net sales, number of returns, and other KPIs.
A product may outsell another but generate less revenue due to a low-profit margin or extended discount offers.
At the same time, a new product may have a ton of net sales and generate more revenue in the short term. But if it causes an increasing number of returns, you're also creating a lot of unhappy customers that could harm your brand in the long run.
The sales by product report lets you see the whole picture and recognize these situations early. You can also speed up data analysis using a Shopify product overview dashboard, which utilizes interactive charts and AI-generated insights.

Sales by traffic referrer drills down into the performance of your customer acquisition channels.
Keep in mind that traffic that doesn't lead to sales is only a vanity metric. To really measure the success of your marketing or advertising efforts, look at how each traffic channel impacts your bottom line.
The sales by traffic referrer report is accessible via the reports page or the main analytics page.

The report itself simply tracks the number of orders and the value of sales per traffic source. Use it to reveal your most profitable customer acquisition channels, like direct traffic, email, and social.
If you aim to identify your most profitable products, the ABC analysis by product report offers an alternative to the sales by product report. ABC analysis systematically ranks your product into three tiers:
In Shopify's ABC analysis by product report, products are automatically assigned to these tiers using sales data over the past 28 days. All you have to do is access the report through your Shopify admin account.

Upon analysis, keep an eye on the stock level of your A-grade products. Since they're responsible for the majority of your revenue, having them out of stock is detrimental to your cash flow.
As for B-grade products, they don't require any inventory management priority. C-grade products, on the other hand, should be liquidated quickly to free inventory space.
Here are a few strategies that will help sell out your C-grade inventory:
The sales by discount report tracks the effectiveness of your discount offers in converting paying customers. It monitors metrics like total orders, discount amount, and gross sales for each discount offer you use.
This particular report is designed specifically to measure and compare the profitability of your special offers. It's also useful in gauging the ideal discount amount that entices the most customers without sacrificing too much in revenue.
Tracking discount sales can also be used for simple influencer or affiliate marketing programs. Assign special discount codes for each partner, start tracking sales, and reward partners who rake in the most customers.
Unlike the sales by traffic referrer report, sales attributed to marketing lets you track purchases generated by specific marketing and advertising campaigns.
You need to add marketing channels to your Shopify admin dashboard before sales data can be tracked. To do this, go to 'Marketing,' select 'Campaigns,' and click 'Create campaign.'
Shopify apps also let you add marketing channels via third-party integrations. Just visit the Shopify App Store, search for the marketing app you need, and follow the on-screen instructions.

For example, if you plan to use Facebook ads to attract customers, visit the app store and search for "Facebook ads."
Look for a platform you're familiar with or pick something that catches your interest. Before you install a new app, read the reviews and the app's features to see if it fits your marketing requirements.
Click 'Install' to finalize your choice. You'll then be able to complete the installation process through your Shopify admin.

After setting up and launching your marketing channel, Shopify will begin collecting sales data in the background. Data will be tracked in the sales attributed to marketing reports under the connected referring channel and referring categories.
Here's a tip: measure the performance of your marketing and sales funnels periodically, especially after implementing strategic changes or launching new campaigns. This is a surefire way to assess whether or not you're heading in the right direction.
Must-read: Facebook Ads for Ecommerce (Ultimate Guide)
In Shopify, profit margin pertains to a category of reports that track gross profits for products, Point Of Sale (POS) locations, and product SKU variants.
This report category tracks exactly how much is left once all costs are deducted from the value of net sales.
Take note that Shopify can only calculate gross profits if you enter a "cost per item" value for your products. You'll find this setting in the pricing section of your product listing.
The "profit" and "margin" fields will be automatically filled based on your product's price and cost per item.

While important, profit margin isn't always the be-all and end-all of determining the business value of products.
For example, products that are often bought in huge quantities may still generate a lot of revenue despite having low margins. Other products are also sold to raise brand awareness, generate revenue through upsells, or capture customers for repeat purchases in the future.
Customer cohort analysis is a unique report that helps you monitor customer behavior over time. Its main feature is a heatmap that visualizes each cohort's purchases (and repeat purchases) over time.
A cohort is a group of customers that bought within the same time period. Additional details, including marketing channels, products purchased, and geographic locations, are included for each cohort — helping you define your ideal customer persona and predict future shopping behavior.
Customer cohort analysis is a powerful report that will enable you to tailor your special promotions, marketing, and shopping experience to your most profitable customers.
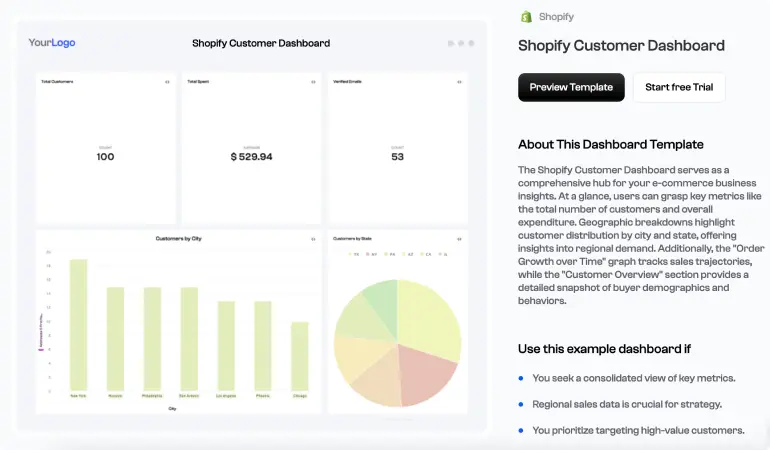
To obtain customer insights better and faster, create a Shopify customer dashboard using Polymer. Doing so lets you leverage dynamic data visualizations for a deeper and more readable view of customer groups, including geographic breakdowns, total purchases, and orders over time.
Aside from customer cohort analysis, Shopify offers a handful of other reports that will help you get to know customers and understand their shopping behavior.
Top online store searches with no results, for example, is a report that lets you discover missing products in your catalog that customers are looking for. This causes you to miss out on potential sales or worse; lose customers to competitors forever.
The report tracks search terms with no results and the number of times they're used. You can quickly sort the data based on popularity to easily identify products you definitely need to sell.
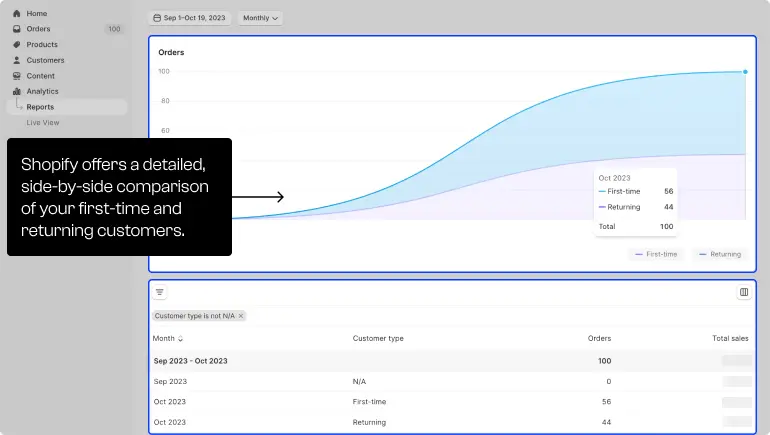
The first-time vs returning customer sales report gauges how effective you are in retaining customers and generating repeat purchases.
This report features an interactive timeline that displays the number of transactions from both customer types within the timeframe. At the bottom of the report, you'll find a detailed view of your returning and first-time customers' purchases over time.
Although first-time customers are indicative of growth, seeing a plateau in your returning customers is a bad sign for your online store's sustainability. It can be a symptom of different problems, like:
Luckily, every problem in ecommerce has a solution. But first, you have to deduce the exact reason why you're not getting repeat purchases.
Again, you need data analysis to make informed decisions that will lead to actual results.
One-time customers are the reason why you're not seeing signs of sustainable business growth, including repeat purchases and year-on-year revenue growth. These are customers who only made one purchase throughout their involvement with your brand.
You'll find out more about them in the one-time customers report. This includes data such as their name, email address, transaction date, and order value — whatever is available.
Learning more about one-time customers provides an opportunity to pinpoint the reasons why they didn't return.
Check for common denominators like the product they bought, when they made their purchase, and the additional fees they paid.
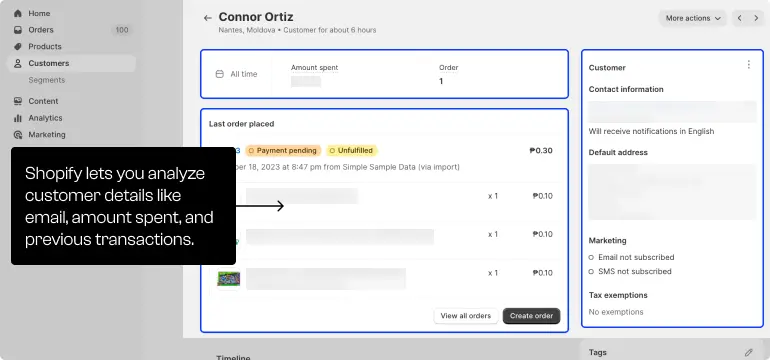
Supplement your analysis with in-depth customer data. Just click 'Customers' from the admin menu and look for customers who only made a single order.
The customer report reveals additional data like their total spend, contact information, location, and products bought. You'll also find a complete timeline of their interactions with your store.
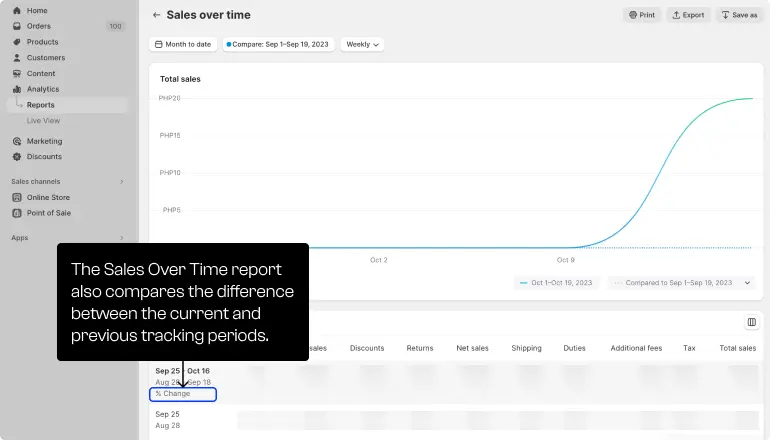
Lastly, you can use the sales over time report as a straightforward barometer for ecommerce growth.
Sales may not be an exact reflection of gross profits. But it's a reliable measure of your online store's popularity and effectiveness in closing transactions, especially when tracked in monthly, weekly, or daily intervals.
The sales over time report includes important sales metrics, like discounts, gross sales, additional fees, taxes, and returns. Most importantly, it calculates the "% change" metric, which compares the performance of the current and previous tracking periods.
It's crucial to incorporate data-driven decision-making into your daily workflow, regardless if you're a new or established ecommerce business.
Shopify's built-in reporting capabilities are indeed useful in tracking ecommerce metrics and KPIs. But once your data inventory grows in size, including data from other sources, hopping from platform to platform for data analysis will get cumbersome.
Consolidate all your ecommerce analytics into a central dashboard with a platform like Polymer.
Use the drag-and-drop interface to create a single source of truth for data analysis. With Polymer's board editor, piece together your Shopify dashboard with customizable data visualizations — from bar charts to pivot tables.
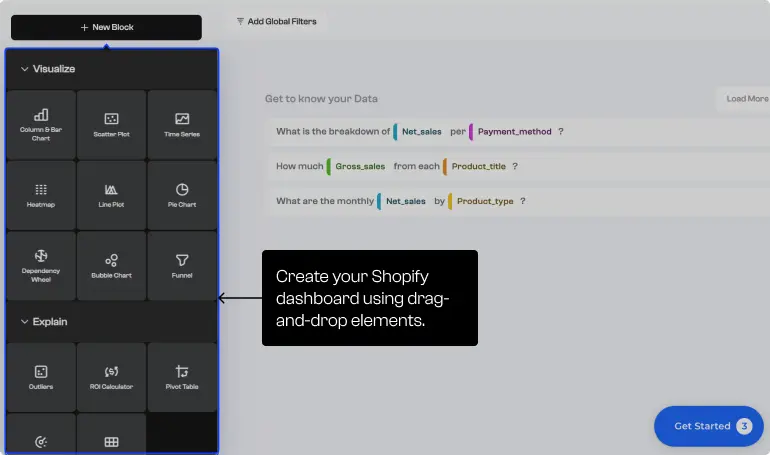
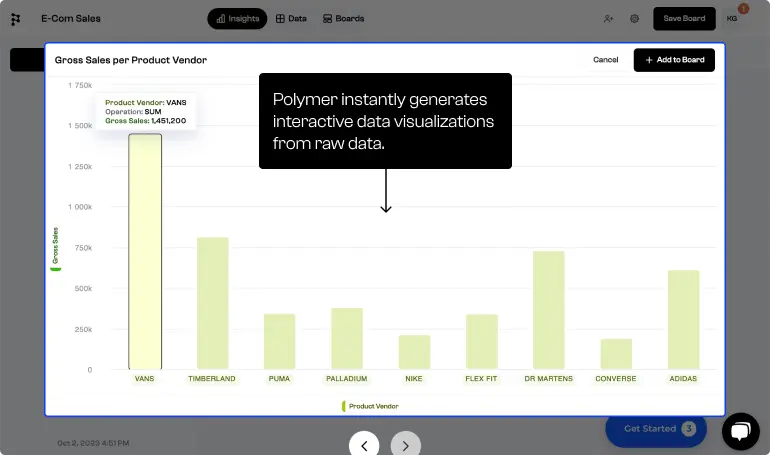
Polymer also presents AI-driven recommendations to instantly pluck actionable insights from your data.
Suppose you connected Shopify to import your ecommerce sales data. In the board editor, you'll find suggestions like:

With a single click, Polymer generates an interactive data visualization to turn your data into a well-informed decision.
Must-read: Top 10 Best Ecommerce Apps
Ready to let data take the lead?
Remember the following best practices to ensure you get the most out of ecommerce analytics:
Yes, Shopify has built-in reporting for different types of ecommerce analytics. It offers dozens of data reports for customer analysis, sales performance tracking, marketing optimization, and inventory management.
Here are some of the most important ecommerce reports you can get from Shopify:
Measure ecommerce success by tracking KPIs tied to your business goals. This includes year-on-year revenue growth, customer lifetime value, gross profits, and monthly net sales.
Polymer has everything you need to establish a more efficient data management system for Shopify ecommerce.
The Polymer software allows you to:
You can do all this without writing a single line of code.
Best of all, Polymer is very affordable despite many advanced BI features it offers.
See for yourself how fast and easy it is to uncover profitable insights hidden in your data. Get started today, free for 7 days.
Try Polymer For Free


.svg)


