
Template
E-Commerce Business Overview
Combine your Shopify, GA4, Google Ads, and Facebook data for insights across your business.
.svg)
BigCommerce analytics are a treasure trove of valuable insights for online businesses. Learn more about the inner workings of BigCommerce with this comprehensive guide.
BigCommerce analytics is a treasure trove of valuable insights for online businesses.
It shows your total sales, traffic generated by channel, conversion rates, etc.
Essentially, BigCommerce analytics uncovers critical data that enhance ecommerce marketing strategies, informs strategic decision-making, and propels business growth.
The question is, how do you navigate BigCommerce analytics to extract the insights you’re looking for?
What key factors should you consider to ensure its effectiveness for your needs?
That’s what we’ll cover in this guide.
Continue reading this comprehensive guide to learn more about the inner workings of BigCommerce analytics.
BigCommerce is a popular ecommerce platform that makes running an online business so much easier.
The platform is a one-stop solution with all the works, including website builders and ecommerce analytics features to simplify starting, managing, and growing your online business.
BigCommerce’s main features help you:
BigCommerce has had notable success, with data showing that the platform’s users have a 28% average growth rate.
BigCommerce is scalable, user-friendly, and has robust online selling, marketing, CRM, and analytics features.
The platform offers a straightforward interface with customizable web page templates for beginners and experts.
Its built-in features include a responsive mobile design, various payment options, and strong security options, giving you a comprehensive solution to seamlessly create, run, and manage your online store.
The platform’s other key features include:
BigCommerce analytics is an extensive tool for collecting, analyzing, and using data to meet marketing and business goals.
You can use the tools to track and measure your data, including performing an ad hoc analysis.
It can give you reports and real-time insights to understand visitor metrics, identify trends, shape your online selling strategies, and optimize your ecommerce marketing campaigns.
Ecommerce Analytics includes the following features and functionalities.
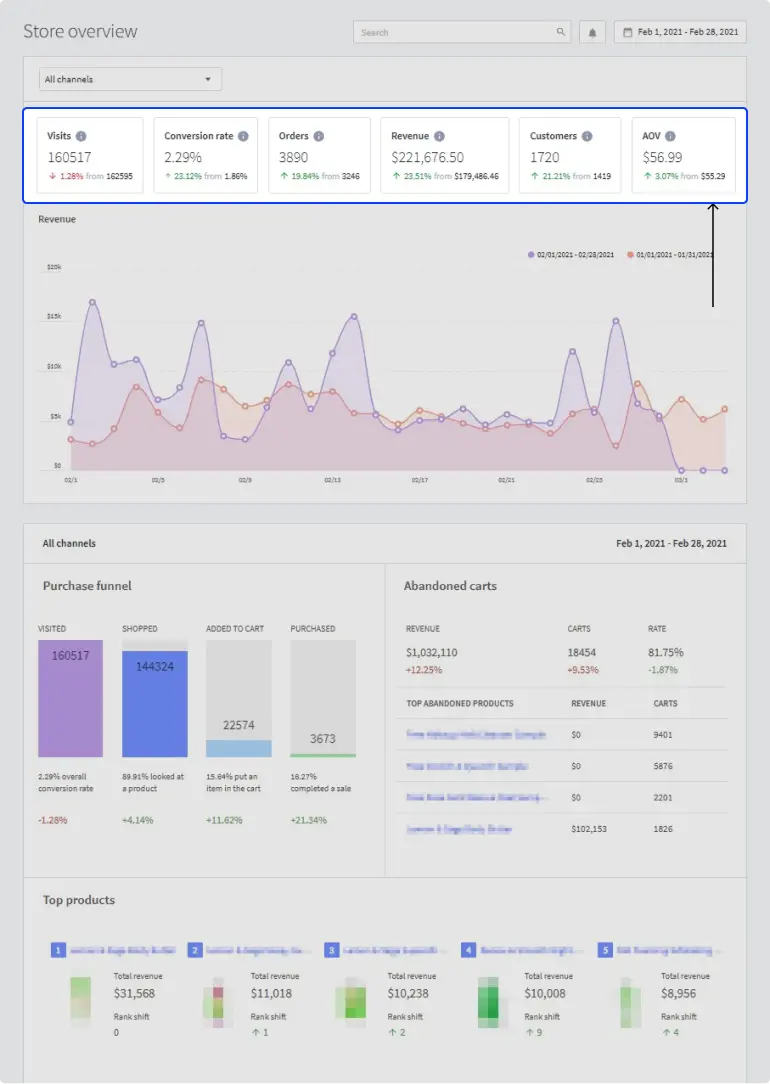
The Store Overview report is a dashboard containing your ecommerce store’s key metrics, such as your number of orders, customers, visits, revenue, and more.
The dashboard gives you a quick overall view of your store’s performance, including high-level summaries of the reports within the analytics suite.
BigCommerce’s built-in analytics suite includes 11 reports based on aspects of your online store operations.
The reports give you an end-to-end, comprehensive view of your marketing channels and online store’s performance across key metrics, from customer engagement to revenue.
We’ll go deeper into the report types you can get with BigCommerce analytics later.
Eligible order types (and their status) from your storefront, control panel (manual orders), Amazon, Facebook, eBay, and third-party programs connected via APIs are also included in Ecommerce Analytics Reports.
Most reports from BigCommerce analytics update in near real time (within 60 seconds)
The reports (with a few exceptions) show a timestamp at the bottom.
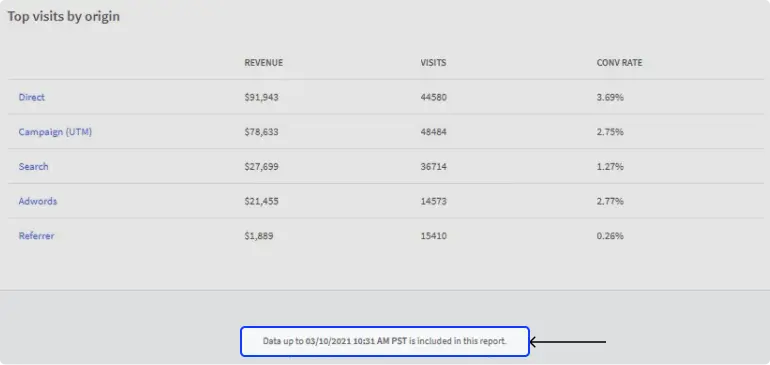
The timestamp indicates when the data was last updated.
Analytics reports (except the Real-Time report) include a date range selector that lets you display data from a specific period.
You can choose from a preset or a custom date range by clicking Custom and selecting your preferred dates.

(Source: https://support.bigcommerce.com/s/article/Ecommerce-Analytics?language=en_US)
You can compare specific reports to another date range, such as the previous period or year or a custom range.
Some of BigCommerce’s Analytics reports include graphs and visualizations.
The visualization can display additional data when you hover your mouse over a point on the graphs.
Graphs represent vital data and insights, making them easier to understand and convey to your stakeholders.
BigCommerce lets you export the following Ecommerce Analytics data as a CSV file.
Select the data range that covers the data table you want to export and click the Download as CSV button.
The system will notify you when your export is generated and ready to download to your local computer’s drive.
Ecommerce Insights is a premium BigCommerce analytics feature that you can add to the reports that come with your plan.
The feature helps you dive deeper into your data for more insights.
For instance, you’ll know the marketing channels that get you high-value customers over the course of their relationship with your brand based on your online store’s data.
Ecommerce Insights has the following features:
The key to harnessing the power of BigCommerce analytics is understanding how to leverage it correctly.
Like what CEO Matin Movassate said…
“Analytics software is uniquely leveraged. Most software can optimize existing processes, but analytics (done right) should generate insights that bring to life whole new initiatives. It should change what you do, not just how you do it.”
BigCommerce’s Ecommerce Analytics feature can generate these crucial reports.
The Store Overview Report acts as a comprehensive dashboard that gives you a complete overview of your key metrics for easy business performance tracking and assessment.
It includes the following data and components:
The Merchandising Report allows you to drill down on your product catalog to understand its performance better.
The merchandising report contains the following elements and data:

(Source: https://support.bigcommerce.com/s/article/Merchandising-Report?language=en_US)
The In-Store Search Report shows your shoppers’ experience and success rate when they use your ecommerce website’s search function.
The In-store Search report includes the following:

(Source: https://support.bigcommerce.com/s/article/In-Store-Search-Report?language=en_US)
Like many top marketing analytics tools, BigCommerce analytics provides a Marketing Report that shows how your visitors find your store. It helps you determine the effectiveness of your marketing campaigns.
The Ecommerce Analytics Marketing Report contains the following information:

(Source: https://support.bigcommerce.com/s/article/Marketing-Report?language=en_US)
The Customers Report helps you better analyze and understand your store's customer behavior.
The data includes where your customers come from and the percentage of new versus returning customers, including their total spending the last time they placed an order.
The report also shows individual customer profiles that show every order the customer placed and the product they purchased in your store.
The Customers Reports contain the following data:

(Source: https://support.bigcommerce.com/s/article/Marketing-Report?language=en_US)
Other Ecommerce Analytics Reports you can generate with BigCommerce analytics include Real-Time, Orders, Purchase Funnel, Carts, and Sales Tax reports.
The Key Performance Indicators (KPIs) you track depend on your goals and the data you want to see.
Start with the following essential KPIs every business owner or marketer using BigCommerce should monitor and measure.
Use BigCommerce analytics KPIs with other data analysis tools to get more out of your data.
It’s been successful since 31.9% of BigCommerce Stores use Google Analytics.
BigCommerce stands out from other leading solutions because of the following.
When it comes to ecommerce analytics, remember this quote from MoviePass CEO and Netflix Co-founder Mitch Lowe…
“Use analytics to make decisions. I always thought you needed a clear answer before you made a decision and the thing that he taught me was [that] you’ve got to use analytics directionally.”
While BigCommerce analytics offers reliable reports and basic visualizations, you can take your ecommerce data analysis to the next level with Polymer.
Polymer is one of the top 12 ecommerce analytics tools in 2024—its Business Intelligence (BI) software lets you generate reports, visualizations, and dashboards in seconds.
Connect your BigCommerce account via Polymer’s built-in data connector and import your dataset with a few clicks. Also, if you analyze data in Excel, you can upload the XLS file and visualize the dataset with Polymer.
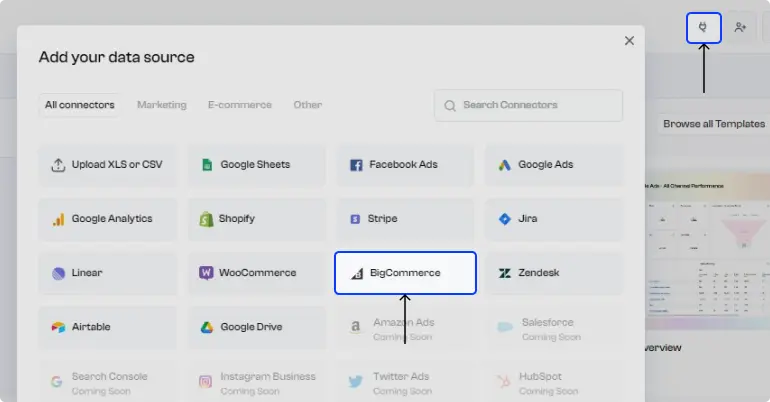
You can connect other data sources such as Facebook ads and Google Analytics 4. Read this Google Analytics 4 Ultimate Guide to learn more.
Instantly generate graphs, tables, maps, plots, and more from your BigCommerce data by choosing from Polymer’s recommended visualizations.

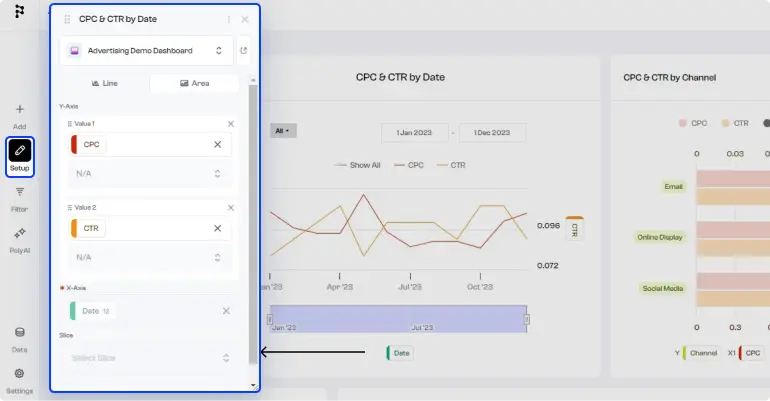
You can edit and customize charts and other dashboard elements in each Block through the Setup option.
Another feature that makes Polymer one of the best AI tools to analyze data is its PolyAI feature.
The feature can analyze your data and provide auto-suggested charts for quick and easy Block customization and dashboard building.
In a battle between Polymer vs. Juice Analytics, Polymer takes the cake.
The software lets you build a complete, interactive ecommerce dashboard in minutes—and you can accomplish this without a complex setup, technical skills, or coding anything.

Polymer is one of the perfect exploratory data analysis tools to supercharge your ecommerce analytics needs.
Harnessing the power of BigCommerce analytics can be the key to driving business success and growth.
Leverage BigCommerce analytics to equip yourself with the insights and information you need to optimize your online business strategies, boost your store’s performance, and make informed decisions.
Also, level up your business data analytics with Polymer’s easy-to-use yet advanced BI functionalities.
With Polymer, you can create stunning, easy-to-understand, and insightful reports in a matter of seconds.
Start a Polymer account for free to experience the software’s powerful BI and data visualization features.
See for yourself how fast and easy it is to uncover profitable insights hidden in your data. Get started today, free for 7 days.
Try Polymer For Free


.svg)


