13 min

How to Build an eCommerce Dashboard

Boost eCommerce with efficient data visualization dashboards. Make faster decisions, streamline data analysis, and align with business goals. Learn more in this detailed guide!

How to Build an eCommerce Dashboard

Data visualization is a game-changer for eCommerce businesses.

A meticulously designed eCommerce dashboard empowers online store owners to make smart decisions quicker.

It helps you avoid the hassle and time-consuming task of sifting and sorting through raw, unorganized data.

Data analysis efficiency skyrockets since your dashboard only presents reports aligned with your business goals.

Continue reading this guide to learn how to build an eCommerce dashboard.

Table of Contents

  • What is an eCommerce dashboard?
  • Top benefits of building an eCommerce dashboard
  • Planning your eCommerce dashboard
  • Data collection methods for eCommerce
  • Building your eCommerce dashboard with Polymer
  • Tips for creating an effective eCommerce dashboard
  • How to build an eCommerce dashboard: FAQs
  • Create a readable and interactive eCommerce dashboard with Polymer

What is an eCommerce dashboard?

An eCommerce dashboard is a centralized hub for eCommerce business performance metrics and Key Performance Indicators (KPIs). It contains charts, tables, and other data presentation elements to turn data into actionable insights

Data dashboards enable organizations to make data-driven decisions more reliably and efficiently.

With a Business Intelligence (BI) platform like Polymer, quickly build readable dashboards for your eCommerce team using Polymer’s drag-and-drop editor. 

Polymer integrates directly with popular services like Jira, Facebook Ads, and Shopify to seamlessly import data—providing your eCommerce business with a single source of truth.

It also offers advanced, AI-powered features so you can generate instant insights, organize data, or build entire dashboards from scratch.

Top benefits of building an eCommerce dashboard

Here are some of the top benefits of creating a data dashboard for your eCommerce business:

  • Identify your top performers. An eCommerce dashboard makes it easy to spot your top-performing product categories, sales channels, and so on. This unveils growth opportunities you can pursue through strategic marketing, advertising, and product development decisions. 
  • Understand your best customers. Data dashboards can aggregate and visualize information to help you analyze customer demographics and behavior. Identify countries with the most orders, track repeat customers, learn their preferred online shopping device, and more. 
  • Spot weaknesses in your eCommerce channels. With a data dashboard, consolidate data from web analytics and built-in insights from eCommerce platforms to underline underperforming products. Google Analytics 4, for example, can supply your dashboard with metrics that analyze your traffic sources. 
  • Streamline your inventory management. Your eCommerce dashboard can help you track inventory management KPIs and metrics in real time, allowing you to set automated alerts and make quick decisions. This requires a powerful data integration tool or BI platform that connects directly to your eCommerce platform. 
  • Make data readable to stakeholders. Data scientists aren't the only stakeholders of eCommerce data, which is why dashboards are designed to be accessible to non-technical users. This empowers investors, web developers, marketers, business partners, and other data stakeholders with data to make data-driven decisions. 
  • Optimize your marketing efforts. Most eCommerce platforms include marketing KPIs and metrics in their data pool. Incorporating marketing data like click-through rate, traffic, and email open rate into your dashboard lets your marketing team leverage interactive visualizations and automation workflows for their decision-making. 
  • Enhance customer service. Data dashboard platforms like Polymer integrate with Customer Relationship Management (CRM) software, helping you provide the best possible experience for customers. This Zendesk dashboard template, for example, lets your team analyze insights like satisfaction ratings, ticket trends, and ticket status breakdowns.

Planning your eCommerce dashboard

Before you build an eCommerce data dashboard, you need to pin down a handful of important details to guarantee success.

What are your eCommerce analytics goals?

First, conduct a needs analysis to ensure your dashboard produces actionable insights that help accomplish business objectives. This will also help you decide on the layout and visual elements in your data dashboard.

Begin by defining your data dashboard's purpose. In an eCommerce context, this may revolve around business objectives like increasing online sales, improving inventory management, optimizing marketing campaigns, and enhancing customer satisfaction.  

Document your eCommerce analytics goals to help guide the rest of your data dashboard plan.  

Which eCommerce platforms do you use?

Most modern eCommerce platforms come with built-in analytics reporting capabilities. 

Although they essentially work the same and track similar metrics, they might differ in terms of data integration and automation features. These factors affect how you build and configure your eCommerce dashboard. 

As a catch-all, spreadsheet tools like Google Sheets are capable of processing data exports from almost every eCommerce platform. It supports data from a variety of file types, including XLS, XLTM, CSV, and ODS. 

Google Sheets can be an intermediary between your eCommerce platform and your dashboard builder. 

Alternatively, you can build your eCommerce dashboard within Google Sheets. Insert data charts, scorecards, pivot tables, and custom mathematical formulas to build a fully functional, unique data dashboard at zero cost. 

Must-read: How to Create a Google Sheets Dashboard

What eCommerce metrics do you need to track?

One of the benefits of using spreadsheet software is there are no restrictions regarding the types of data you can process. 

Quantitative metrics like orders made, cancellations, online store traffic, and clicks are fully supported and easy to format. Spreadsheets can also aggregate and process qualitative data like customer feedback, poll responses, and observation notes. 

If you plan to create a Google Sheets KPI dashboard for your eCommerce business, be sure to identify the metrics you need to track. This lets you calculate KPIs with the right formulas and raw data. 

  • Average Order Value (AOV): This KPI measures the average amount customers spend in a single purchase. AOV is calculated by dividing your revenue by the total number of orders.
  • Conversion Rate: In eCommerce, conversion rate measures the percentage of online store traffic that converts into paying customers. Calculate your conversion rate by dividing the number of transactions by your online store's unique visitors over a specific period. 
  • Cart Abandonment Rate: This KPI tracks purchase-intent customers who leave after adding products to their cart or initiating a checkout. To get your cart abandonment rate, use the formula: [(Customers who added to cart - Successful Sales) ÷ Customers who added to cart] x 100. 

Some eCommerce platforms only provide raw data in their reporting tools. As such, you need to organize the available data and calculate the KPIs above yourself. 

Use spreadsheet software, data analysis add-ons, or BI platforms to automate the calculations for your eCommerce dashboard.

Must-read: Google Ads Landing Page Performance Dashboard Templates

Data collection methods for eCommerce

As an eCommerce business, you have several options for data collection depending on your goals. These can be classified under primary data and secondary data sources.

Primary data collection sources for eCommerce

In simple terms, primary data refers to raw insights you collected yourself—usually through traditional methods like: 

  • Surveys: Gather customer survey responses through social media, email, or post-purchase forms. If your eCommerce business has a brick-and-mortar store, you could hand out questionnaires and survey forms to collect relevant customer feedback. 
  • One-on-one interviews: Collect primary, qualitative data by hosting one-on-one interviews with customers via phone or video calls. Prepare a set of questions that yield valuable customer experience KPIs. 
  • Focus groups: Define your participant criteria and round up qualified customers for discussion sessions around important research topics. You may run a focus group at a physical location or online using video conferencing apps. 

Secondary data collection sources for eCommerce

Secondary data pertains to information an external entity collects, organizes, and presents. Note that this includes data from analytics tools and built-in reports from eCommerce platforms. 

Below are some examples of secondary data collection: 

  • Web analytics tools: In addition to online store analytics from your eCommerce platform, you can also rely on web analytics tools for advanced traffic analytics. Google Analytics, for example, is a popular web analytics solution that collects information like monthly traffic, bounce rate, session duration, and conversion goal completions. 
  • Case studies and industry reports: Reputable organizations like HubSpot and Content Marketing Institute periodically release reports that provide insights on trends, customer behavior, and other research subjects. Authoritative eCommerce blogs may also conduct case studies on more specific topics, which you can use to build hypotheses and research goals.
  • Advertising platforms: Source data from your advertising platform to track invaluable metrics like ad spend, Return On Ad Spend (ROAS), and click-through rate. Different advertising networks like Google AdSense and Facebook Ads offer manual data exports and integrations with dashboard tools.  
  • CRM platform reports: CRM platforms like Zendesk automatically track customer service data like Customer Satisfaction (CSAT) score and ticket status. These platforms are equipped with in-app data visualizations, reporting features, and integrations with other data management tools.  
  • Inventory management analytics: Reports created by inventory management and automation solutions help you track important inventory data. This includes inventory stock levels, turnover rate, days on hand, and stock-to-sales ratio. 
  • Statistics services: Websites that research, aggregate, and visualize statistical information like Statista are goldmines of market data. Government websites may also publish studies and survey results, helping you establish benchmarks for your eCommerce dashboard. 
  • Competitor analysis: Use marketing analytics platforms like Semrush, SpyFu, and Ahrefs to obtain performance data on your top competitors. Similar to industry statistics, use this information to set benchmarks and target values for your dashboard. 

Apart from identifying data sources, another important step in data collection is choosing the right tools for consolidating and managing multiple data streams. You can check out the free Google Sheets dashboard templates to see if you find a good match.

Alternatively, you can use Polymer for more robust data management features. 

Polymer supports a handful of data sources to help centralize your data management. This includes Shopify, Google Sheets, Google Analytics 4, Facebook Ads, and Zendesk. 

Once integrated, Polymer automatically raw data from your chosen data source. That means you're ready to construct your eCommerce dashboard using the drag-and-drop editor.  

If your eCommerce tool isn't supported by Polymer via direct integration, compile your data in a Google Sheets dashboard first. 

Must-read: Google Analytics 4 Dashboard Templates

Building your eCommerce dashboard with Polymer

To access your eCommerce data set, click 'All Apps' from the main menu.
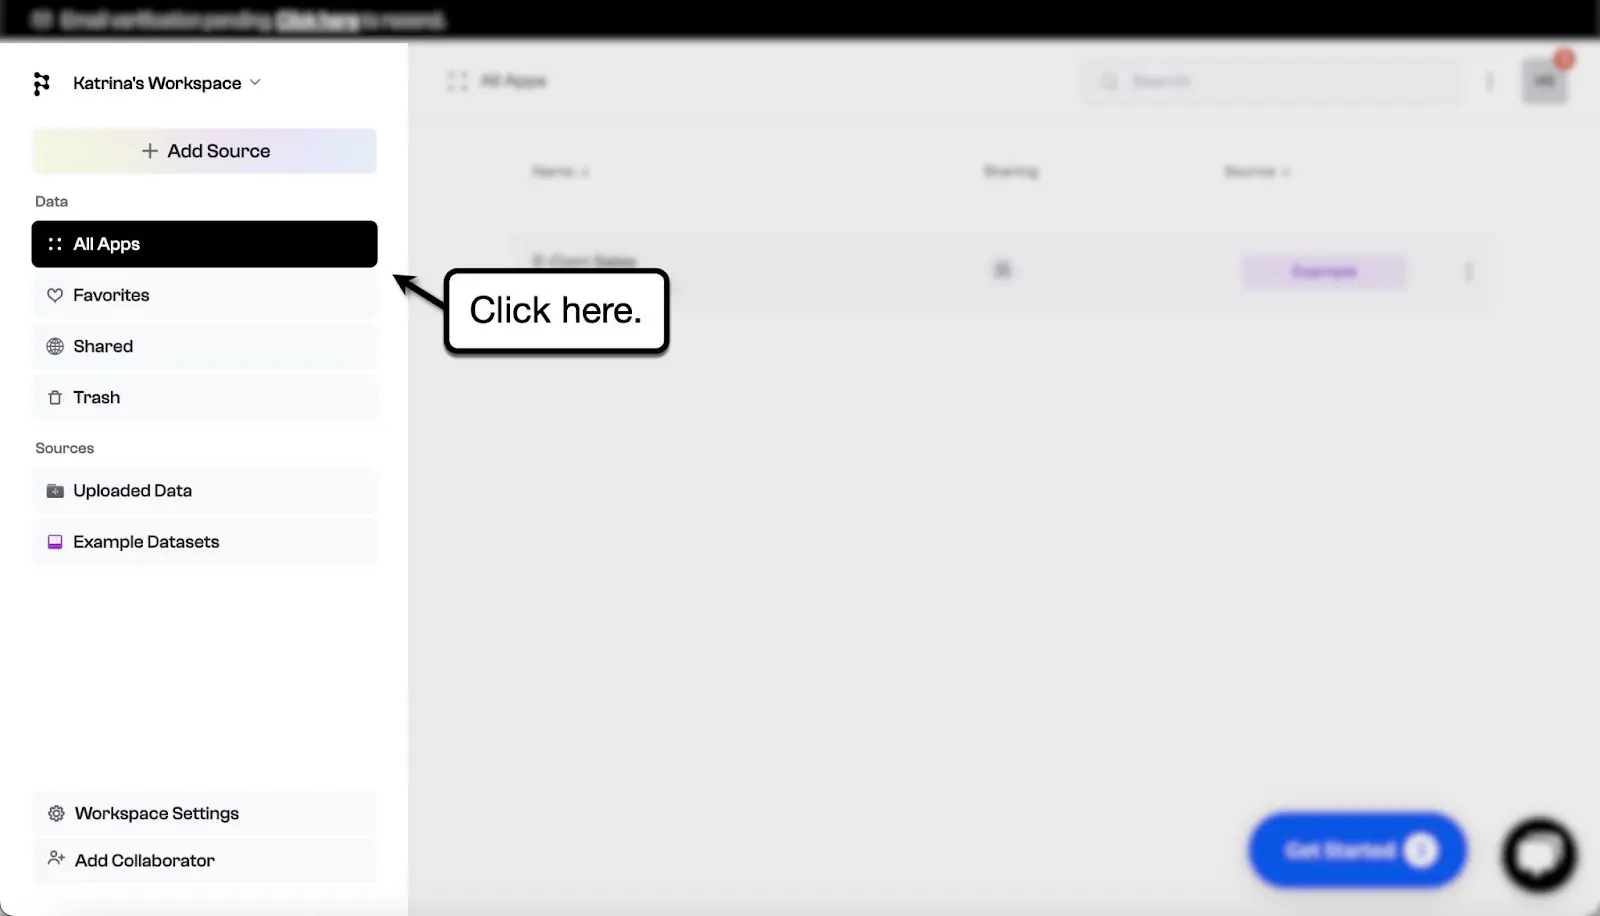
Find and select your eCommerce data set to launch the Polymer editor. 

In the "Insights" tab, you can translate your eCommerce data into interactive data visualizations. 

Click 'New Block' to choose from several customizable visualization tools, including charts, heatmaps, scatter plots, scorecards, and pivot tables. 

Below are examples of Polymer's data visualizations and their possible use cases:

  • Outliers and pivot tables: Use these visualizations to highlight your top-performing products and suppliers. Qualify variables using metrics like gross sales, profit margin, and cost. 
  • Scorecards: You can use scorecards to keep track of essential KPIs, like returns, gross sales, and net profit. Configure scorecards by specifying a target metric, setting a date range, and entering a target value. 
  • Columns and bar charts: Bar charts are flexible visualization tools that can represent a diverse range of eCommerce insights. Compare the performance of different product types, understand your most profitable customer segments, and so on. 
  • Pie charts: Create pie charts to visualize breakdowns and compare data categories. Visualize your breakdown of sales per country, track your most profitable product suppliers, identify your customers' preferred device type, etc.

Each visualization comes with its own configuration and customization options. 

For example, when adding a bar chart, you can select values for your X or Y axis, sort your data, set slices, enable the trend line, and more. 
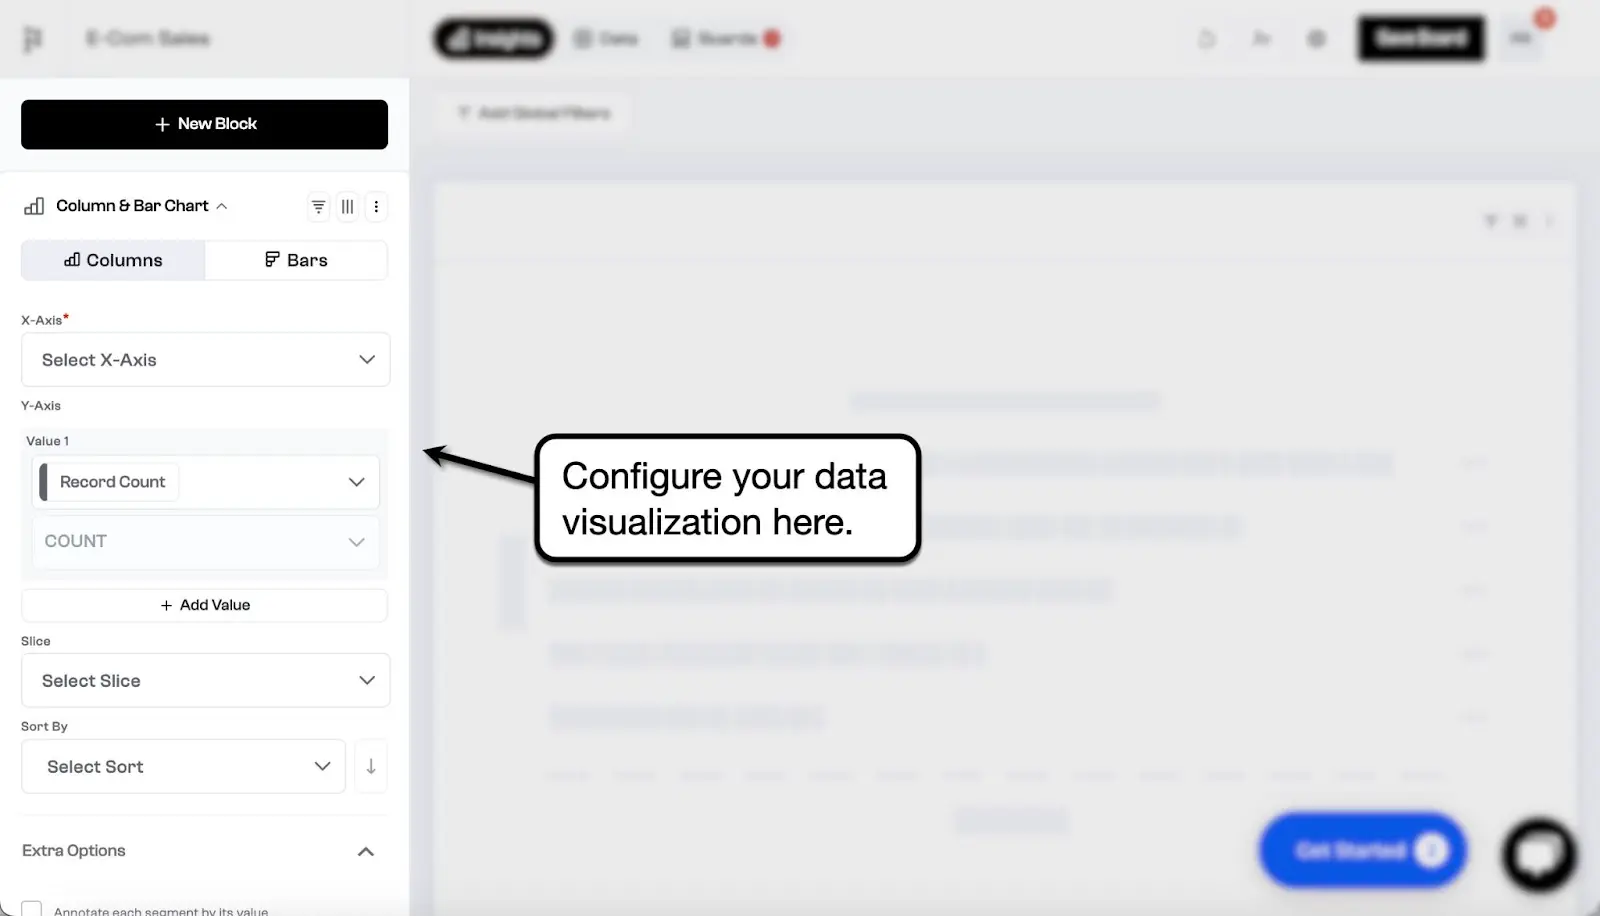
Polymer also offers AI-powered recommendations to extract actionable insights from your data quickly. 

Here are some recommendations you may get with eCommerce sales data sets: 

Clicking an AI recommendation generates a preview of your new data section. If you're happy with the results, click 'Add to Board' to insert the section into your dashboard. 

Of course, AI-powered data visualizations are also fully customizable. You may also change the layout and filters of individual data sections using the Polymer editor. 
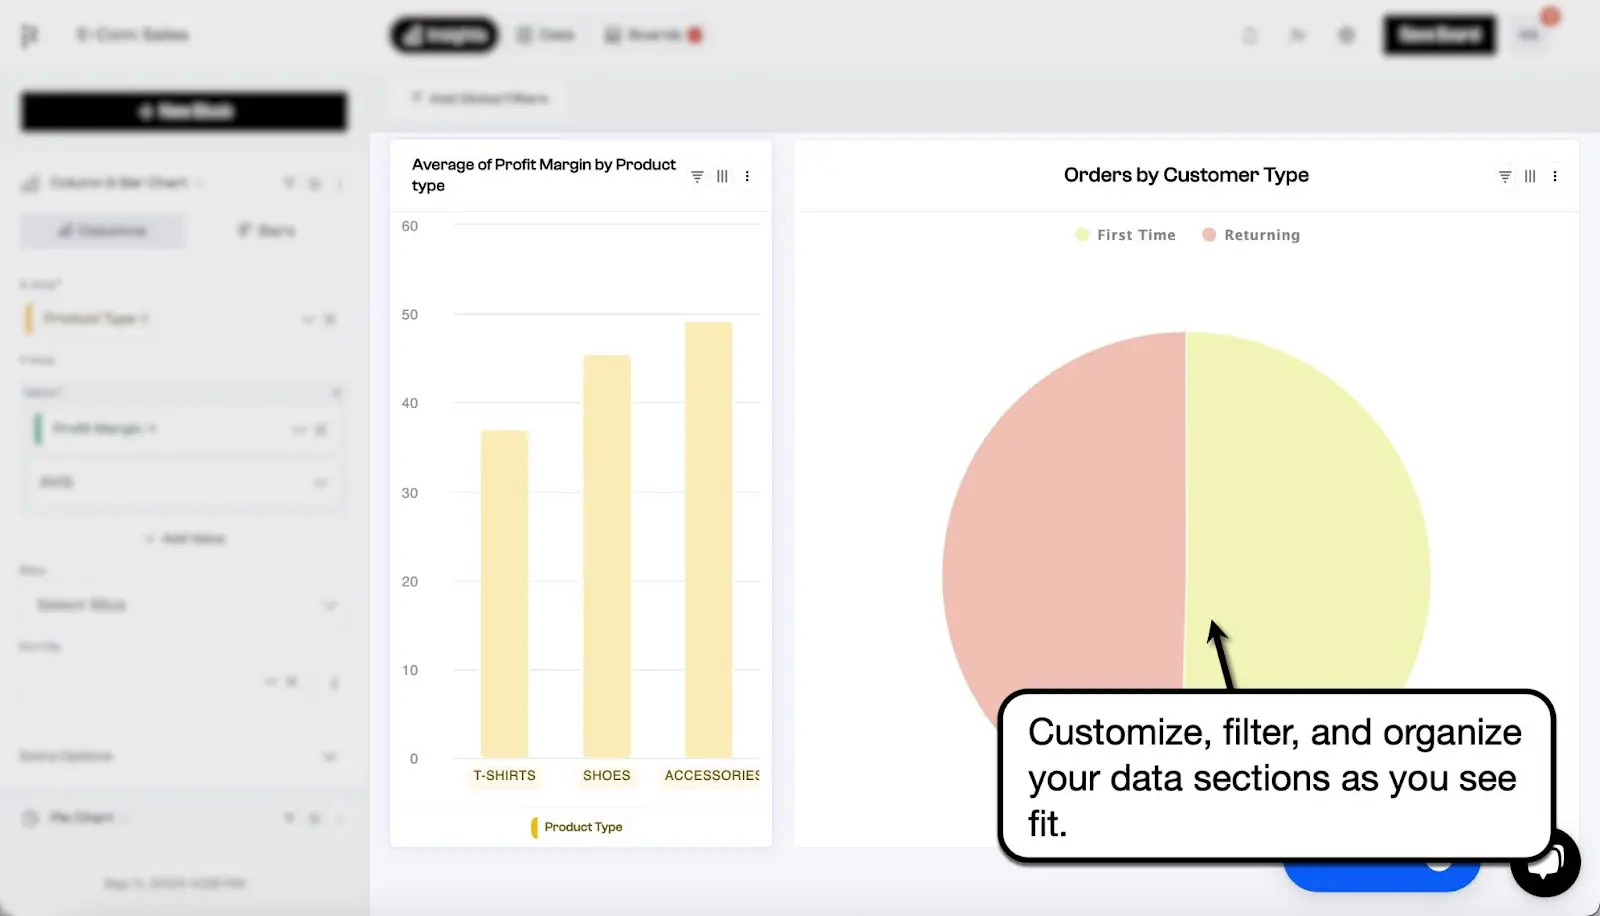
It's also worth noting that Polymer can automatically generate an entire insights dashboard in one click. 

To access this feature, switch to the 'Boards' tab and select 'AI Generated Board.' 

To share your dashboard with teammates, click 'Share' in the top-right corner. 

From there, choose whether to share your dashboard via an embed code or direct URL. Consider creating a password for your eCommerce dashboard to keep your data secure. 
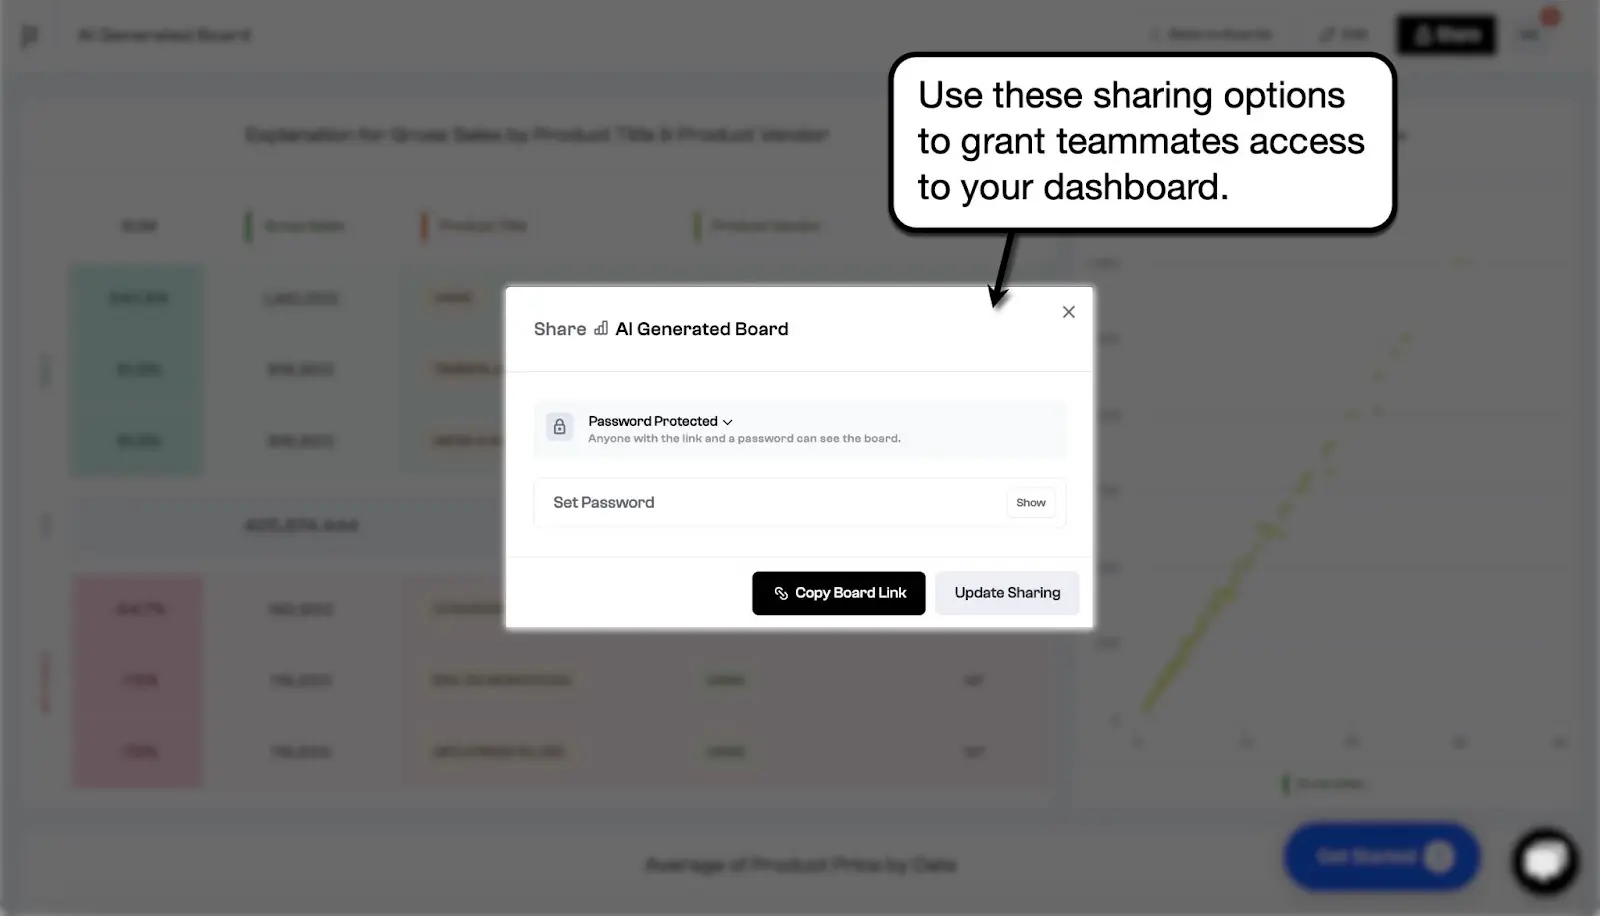
Another way to share dashboards with other users is to invite them as collaborators. Head to Polymer's home page, click 'Add Collaborator,' and set up their workspace account. 

Must-read: Facebook Ads Dashboard Templates

Tips for creating an effective eCommerce data dashboard

Here are dashboard report best practices and tips to help make the most out of your eCommerce data:

  1. Clean your data. Use filters to weed out irrelevant data, delete duplicates, impute or delete missing data, and address formatting/typographical mistakes.  
  2. Create secure data backups. Invest in external data reservoirs or automated backup services as a last layer of defense against data loss.
  3. Apply data optimization techniques. Ensure data quality with integrations for automated synchronization, data validation, segmentation, standardization, and compression. 
  4. Pay attention to interactivity. Dynamic end-user interactions allow you to provide additional, in-depth insights without compromising your dashboard's visual clarity.
  5. Use colors wisely. Utilize color codes to quickly highlight important data, but avoid distracting users with too many colors. 
  6. Gather feedback. Improve your dashboard over time by adding collaborators, collecting feedback, and scheduling brainstorming sessions.
  7. Set clear targets. Use industry or competitor benchmarks to help you identify your top-priority KPIs.  

Must-read: How to Build a Jira Dashboard in Google Sheets

How to build an eCommerce dashboard: FAQs

1. What should be on an eCommerce dashboard?

Your eCommerce dashboard should visualize critical Key Performance Indicators (KPIs) that align with your research goals. Some examples are net profit, gross sales, return rate, cart abandonment rate, and conversion rate.

2. How do I create an eCommerce dashboard?

Steps to creating an eCommerce dashboard: 

  1. Set your dashboard objectives. 
  2. Identify the metrics and KPIs to track.
  3. Choose your eCommerce data sources.
  4. Choose a data management or dashboard platform.
  5. Implement your data collection plan. 
  6. Clean and optimize your data. 
  7. Build your data visualizations. 
  8. Share your dashboard with data stakeholders.

3. Which tool do I use to create a dashboard?

Businesses can use spreadsheet software with data visualization tools like Google Sheets to create eCommerce dashboards. A better alternative would be a full-fledged Business Intelligence platform like Polymer. 

Create readable and interactive eCommerce dashboards with Polymer 

Building a central data dashboard is an important step towards eCommerce success. And to ensure positive results, you need to use the right tools.

Polymer has everything you need to build effective eCommerce dashboards—from data collection to visualization. 

Best of all, you can get started for free. 

Click here to create a free trial account today.

Posted on
September 13, 2023
under Blog
September 13, 2023
Written by
Rand Owens
Founding team member at Motive (Formerly KeepTruckin) and passionate about all things Marketing, RevOps, and Go-To-Market. VP of Marketing @ Polymer Search.

Explore Our Pre-Made Templates & Related Articles:

Browse All Templates

Related Articles

Browse All Templates
No items found.

Start using Polymer right now. Free for 7 days.

See for yourself how fast and easy it is to uncover profitable insights hidden in your data. Get started today, free for 7 days.

Try Polymer For Free